Student Dashboard (B2B)
As a student enrolled in a coaching institute, your dashboard shows batch-specific quizzes, performance compared to batchmates, and institute-assigned study materials. The layout is the same as B2C, with additional institute context.
Video Walkthrough
Dashboard Overview
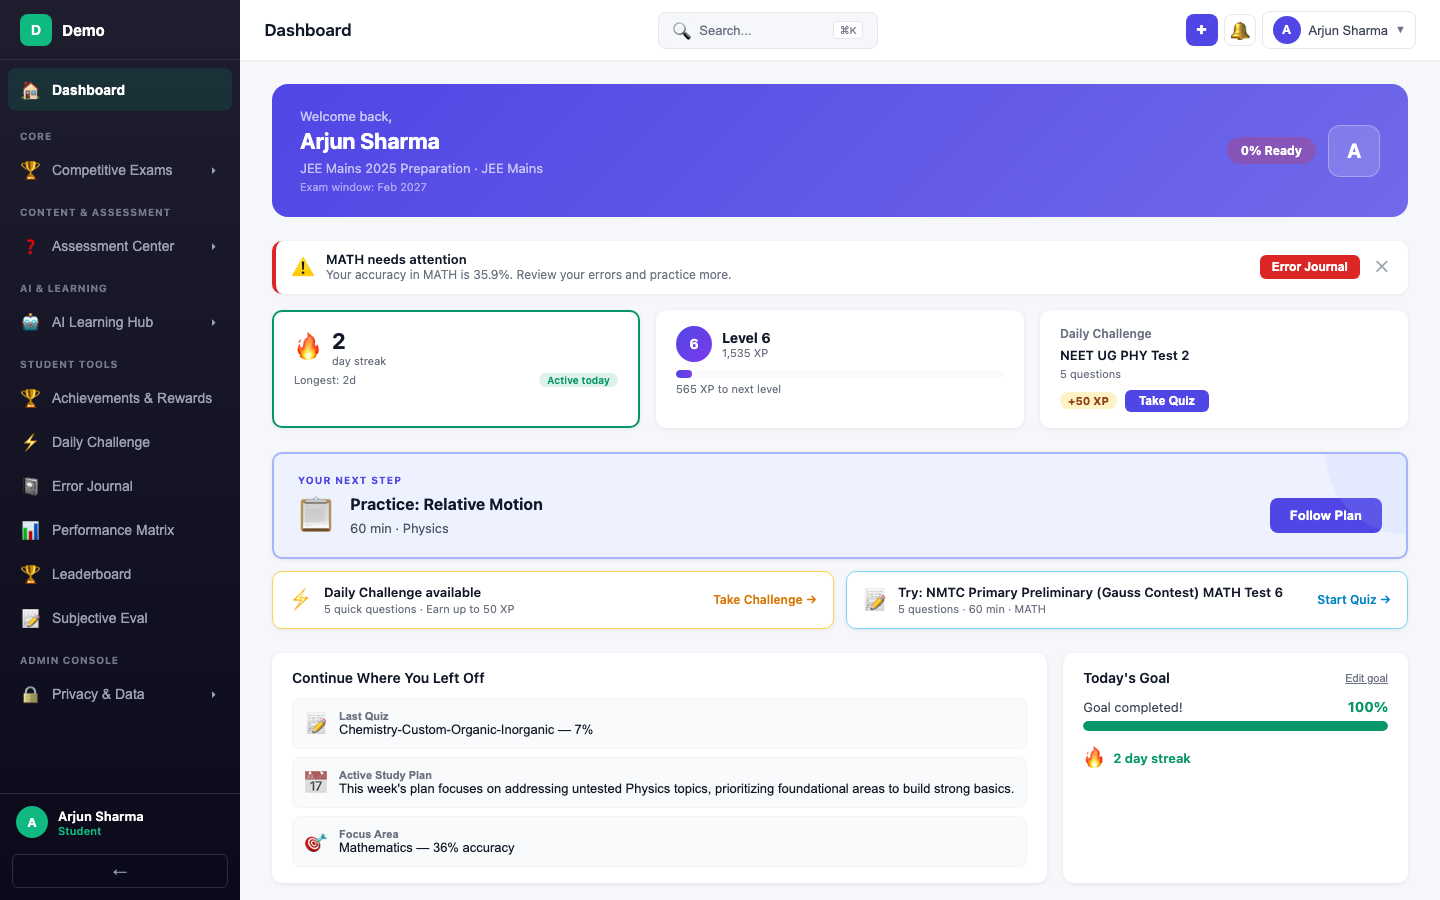
When you log in, the dashboard loads with all your key data in one place.
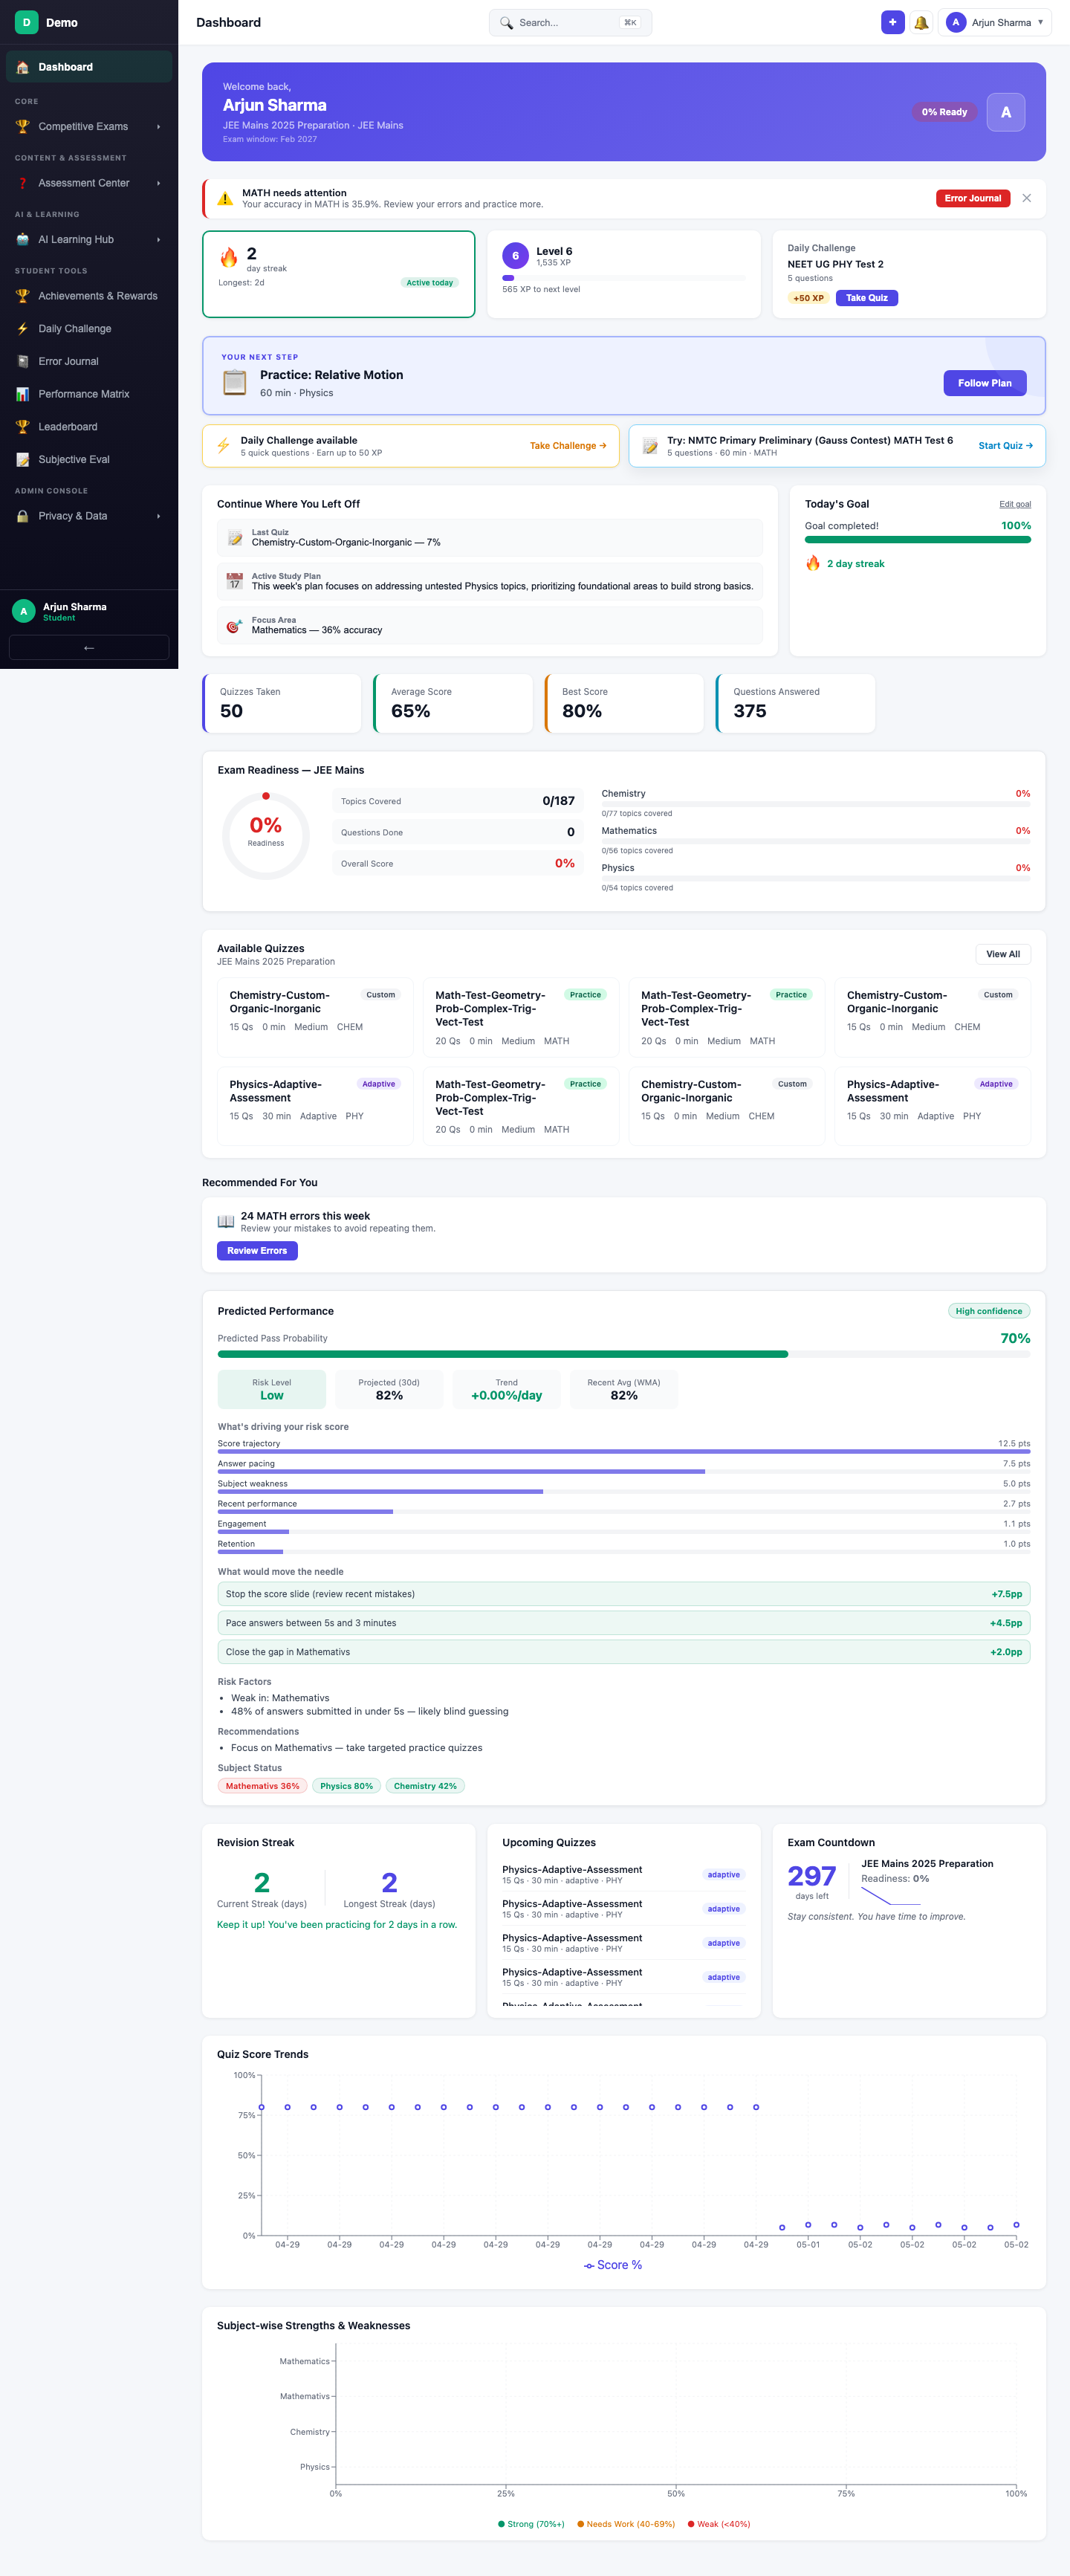
Welcome Banner & Readiness
The top banner greets you by name and shows your institute program (e.g., JEE Mains 2025 Preparation). The Exam Readiness pill (e.g., 0% Ready) gives you an instant snapshot of how prepared you are.
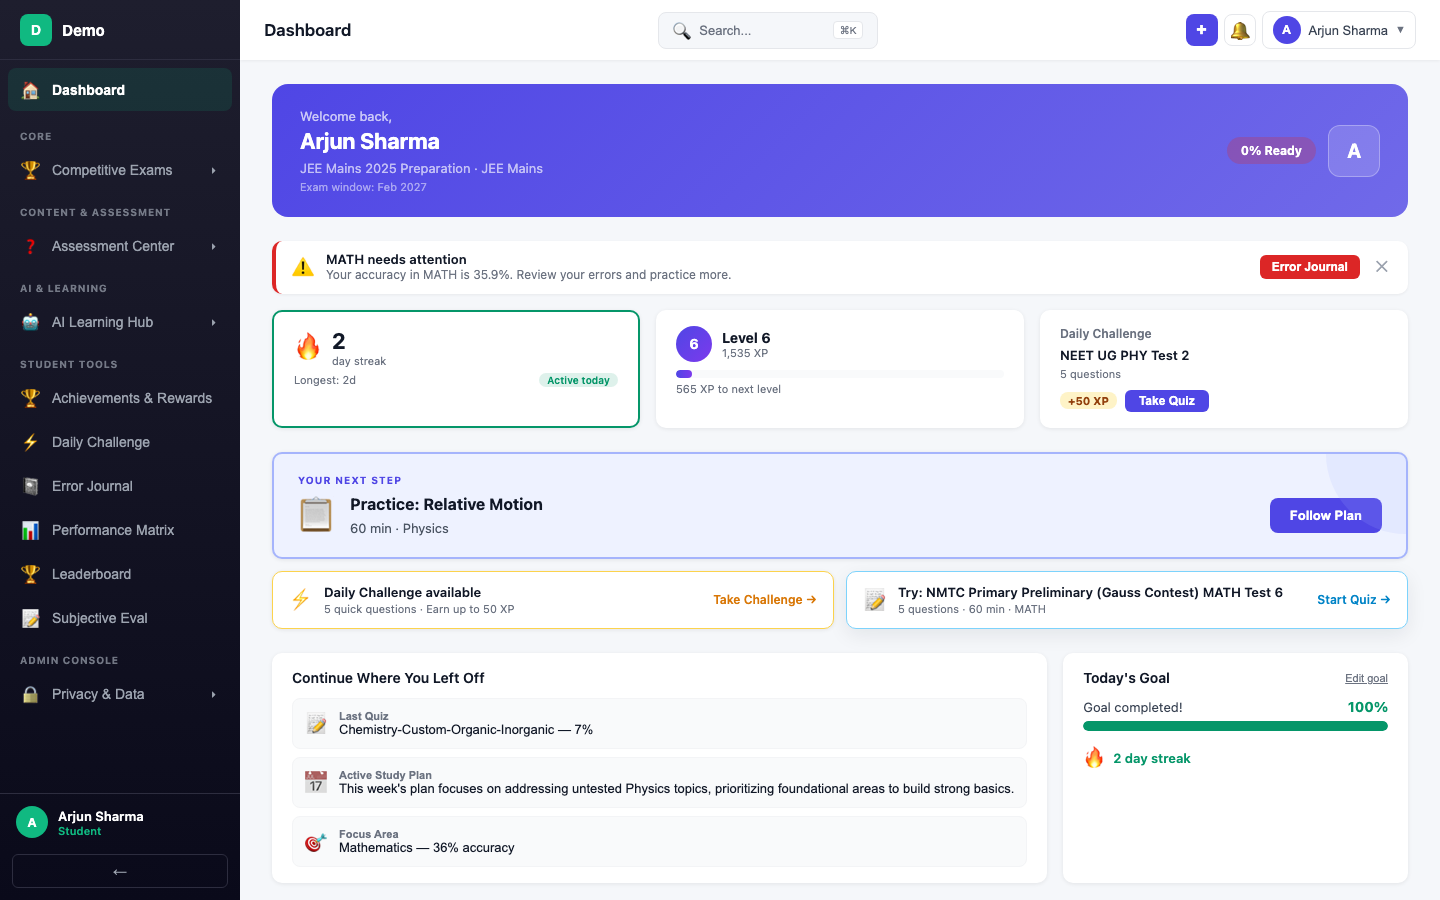
Streaks & Level
Below the banner, gamification widgets track your consistency:
- Streak — Current and longest consecutive practice days
- Level & XP — Your current level and progress to the next one
- Daily Challenge — A quick quiz for bonus XP
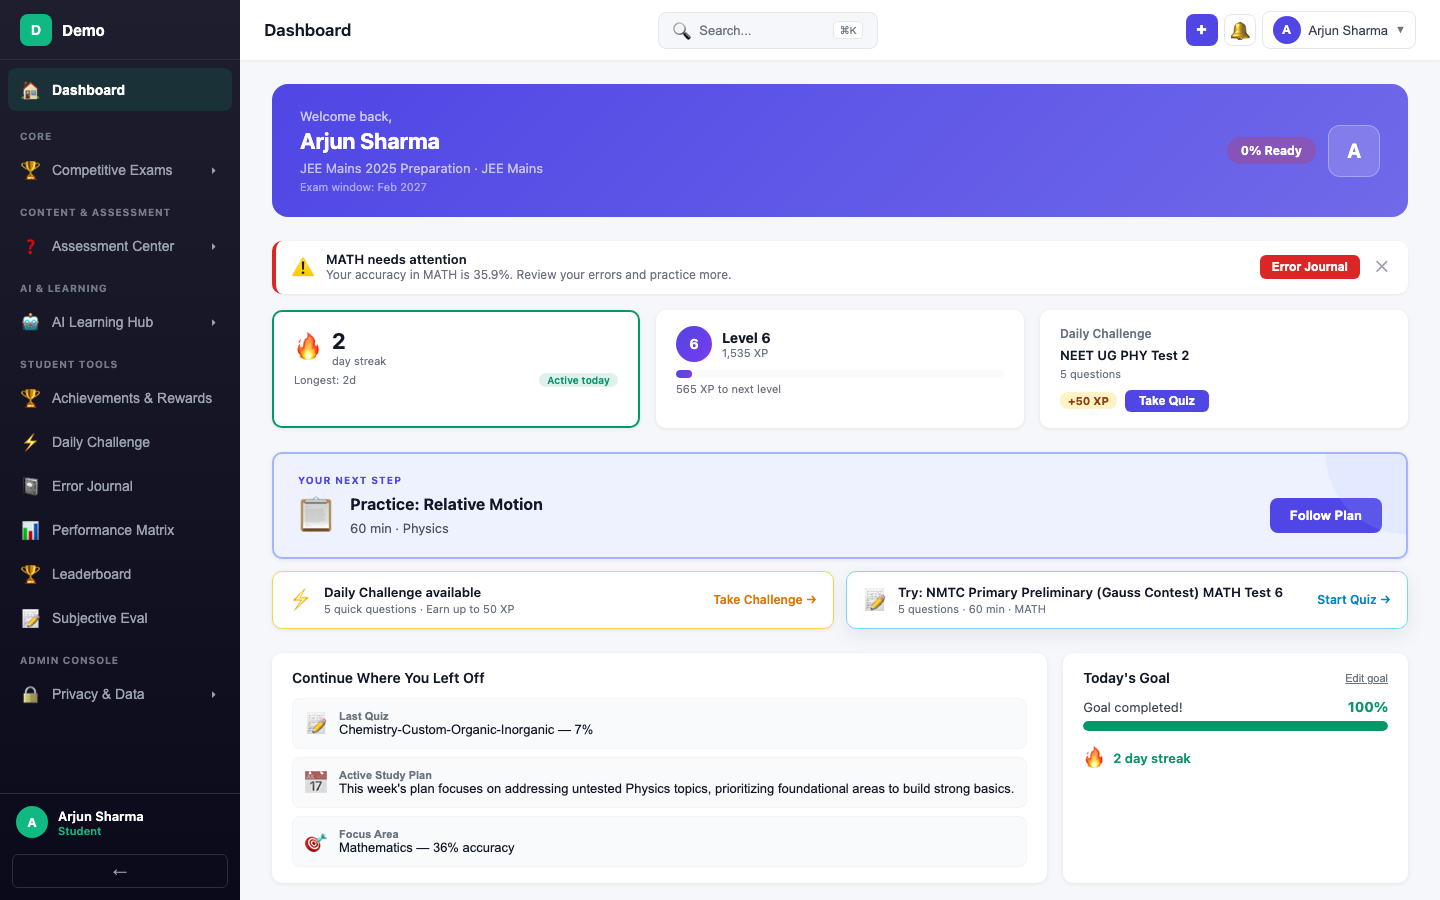
Your Next Step
The Your Next Step card highlights the single most impactful action you should take right now — whether that's following your study plan, taking an institute quiz, or reviewing errors.
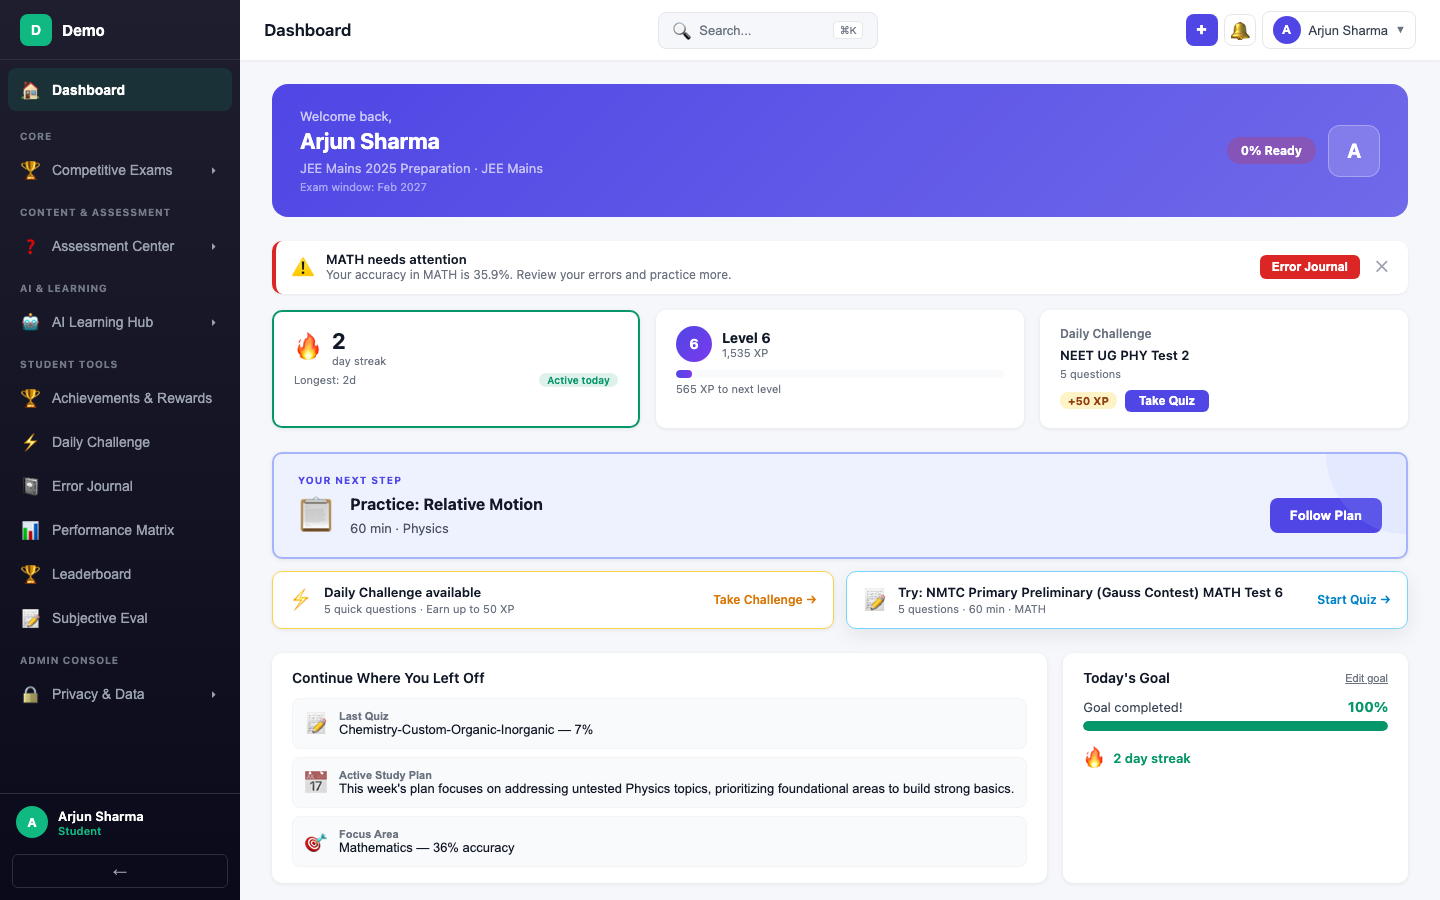
Follow Plan
Click Follow Plan to jump directly to your AI-generated study plan, which aligns with your institute's program schedule.
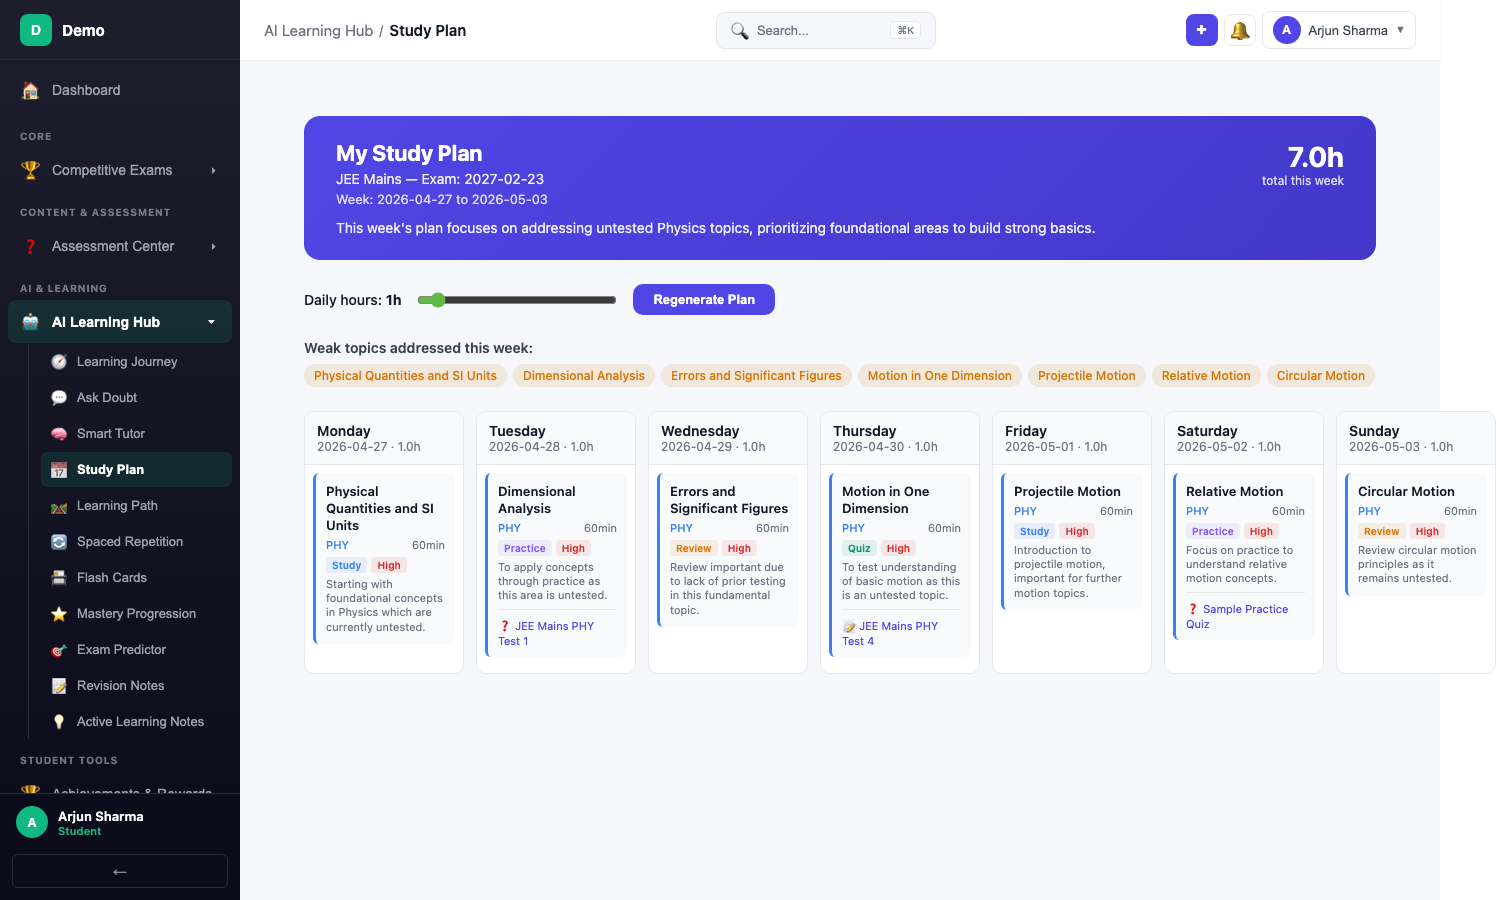
Continue Where You Left Off
Back on the dashboard, this section shows your most recent activity for quick resumption:
- Last Quiz — Your most recent quiz with score
- Active Study Plan — Current week's plan summary
- Focus Area — The subject where you need the most improvement
Key Stats
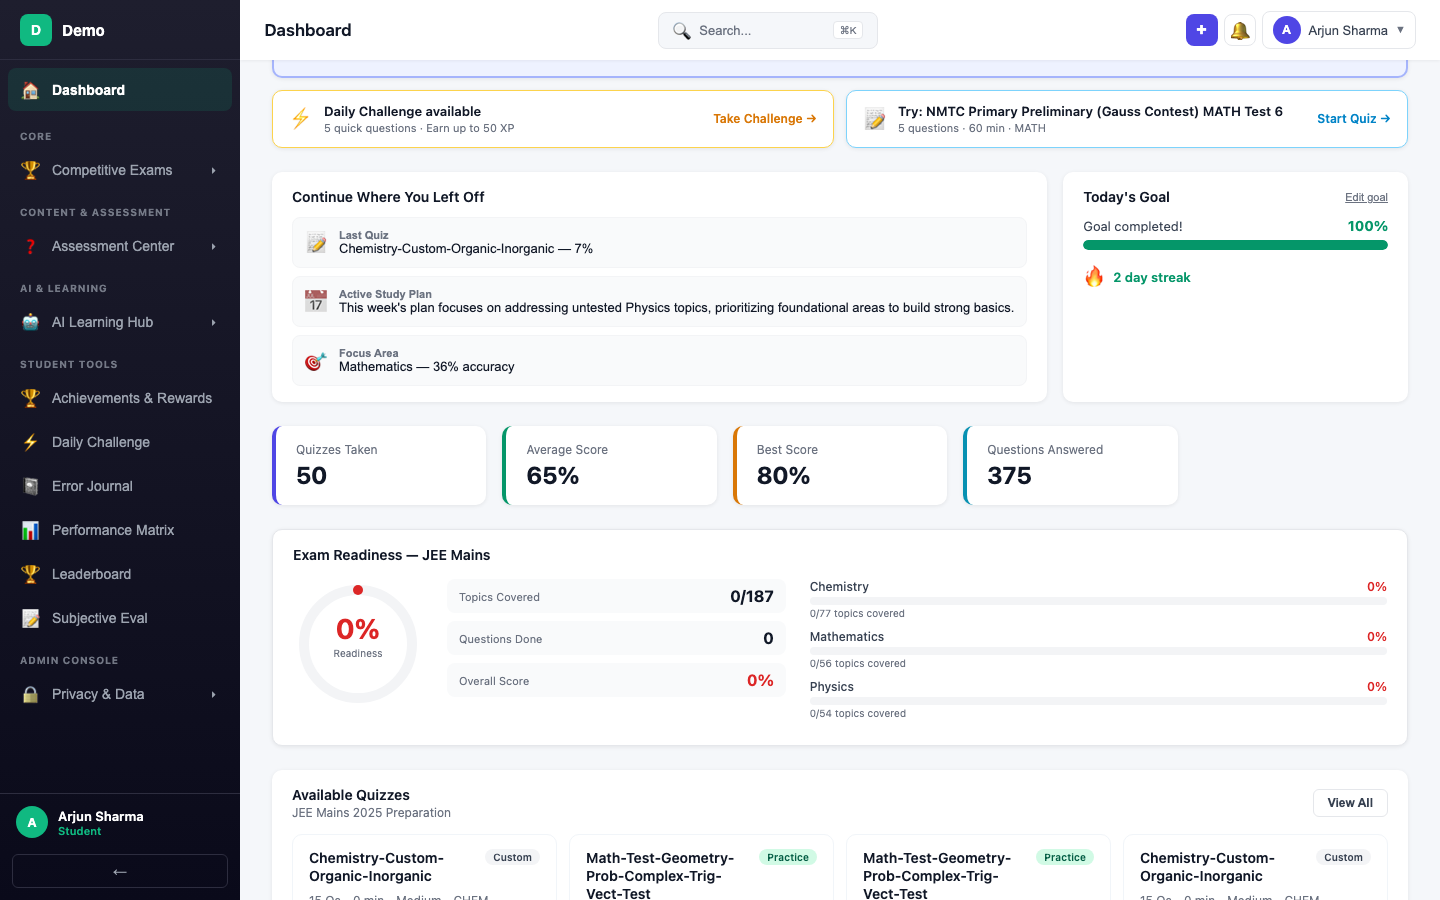
Four KPI cards give you the numbers at a glance:
| Metric | What It Means |
|---|---|
| Quizzes Taken | Total number of quizzes completed |
| Average Score | Your mean score across all quizzes |
| Best Score | Your highest quiz score |
| Questions Answered | Total questions attempted across all quizzes |
Exam Readiness
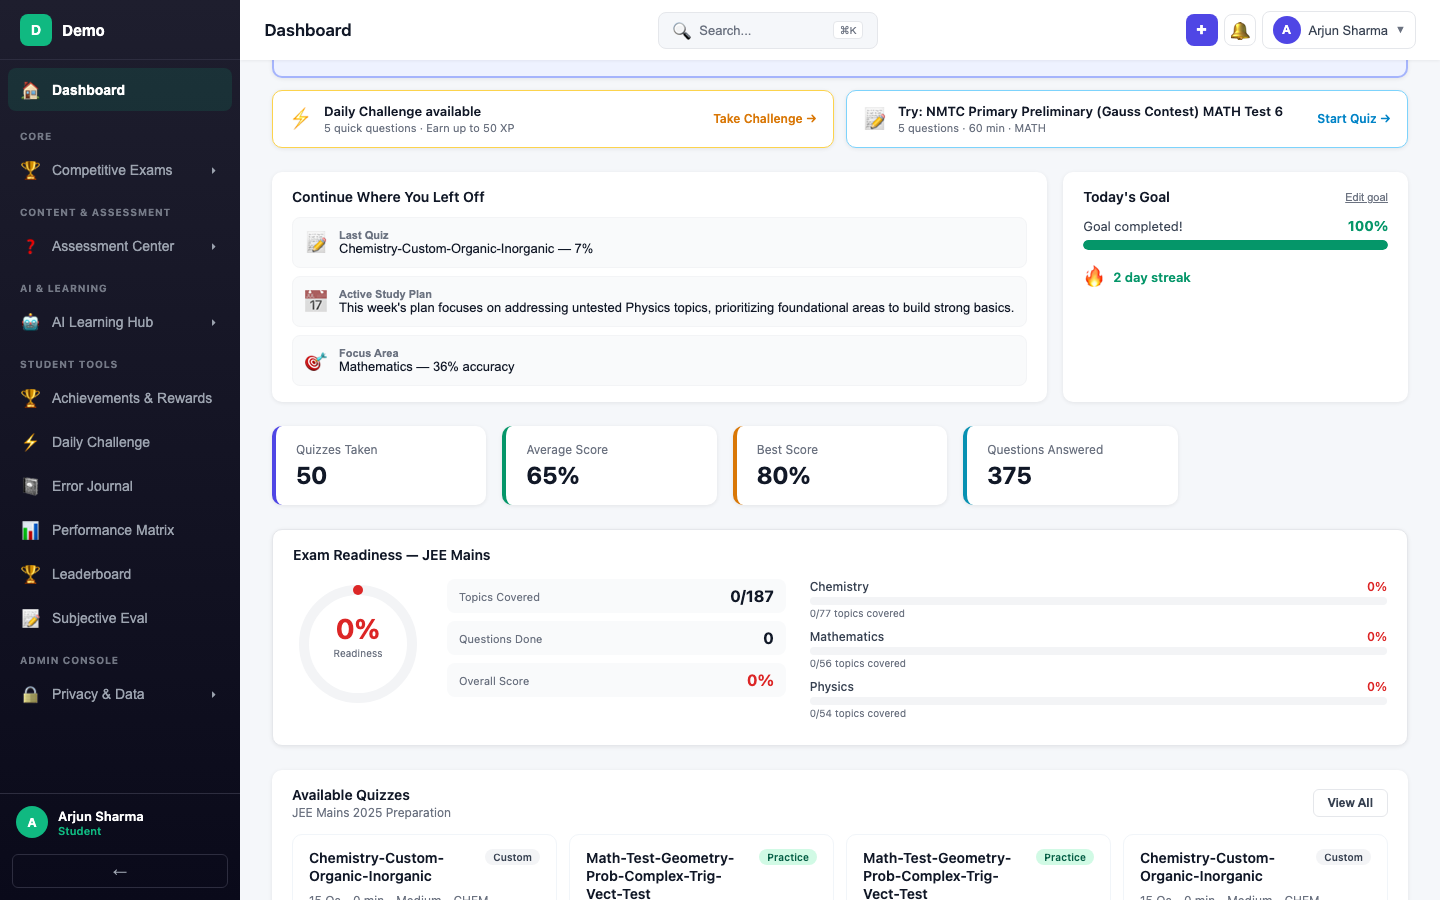
The Exam Readiness section shows a gauge with your overall readiness percentage, plus:
- Topics Covered — How many syllabus topics you've attempted
- Questions Done — Total questions answered
- Overall Score — Your aggregate accuracy
- Per-subject bars — Breakdown by subject with topic coverage
Recommended For You
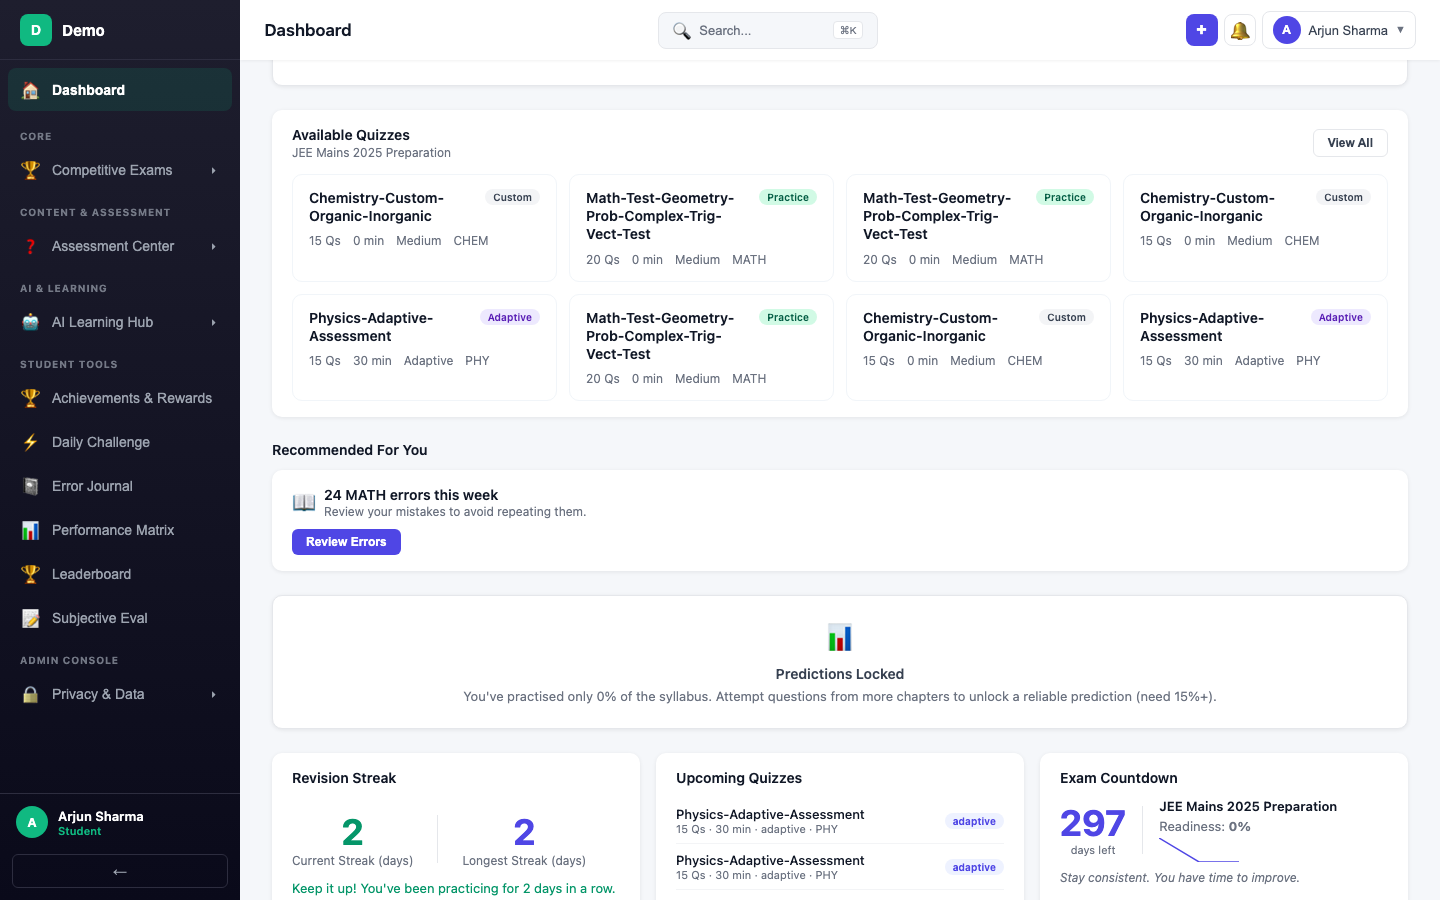
AI-curated actions based on your performance — topics to revise, quizzes to attempt, and study suggestions tailored to your weak areas.
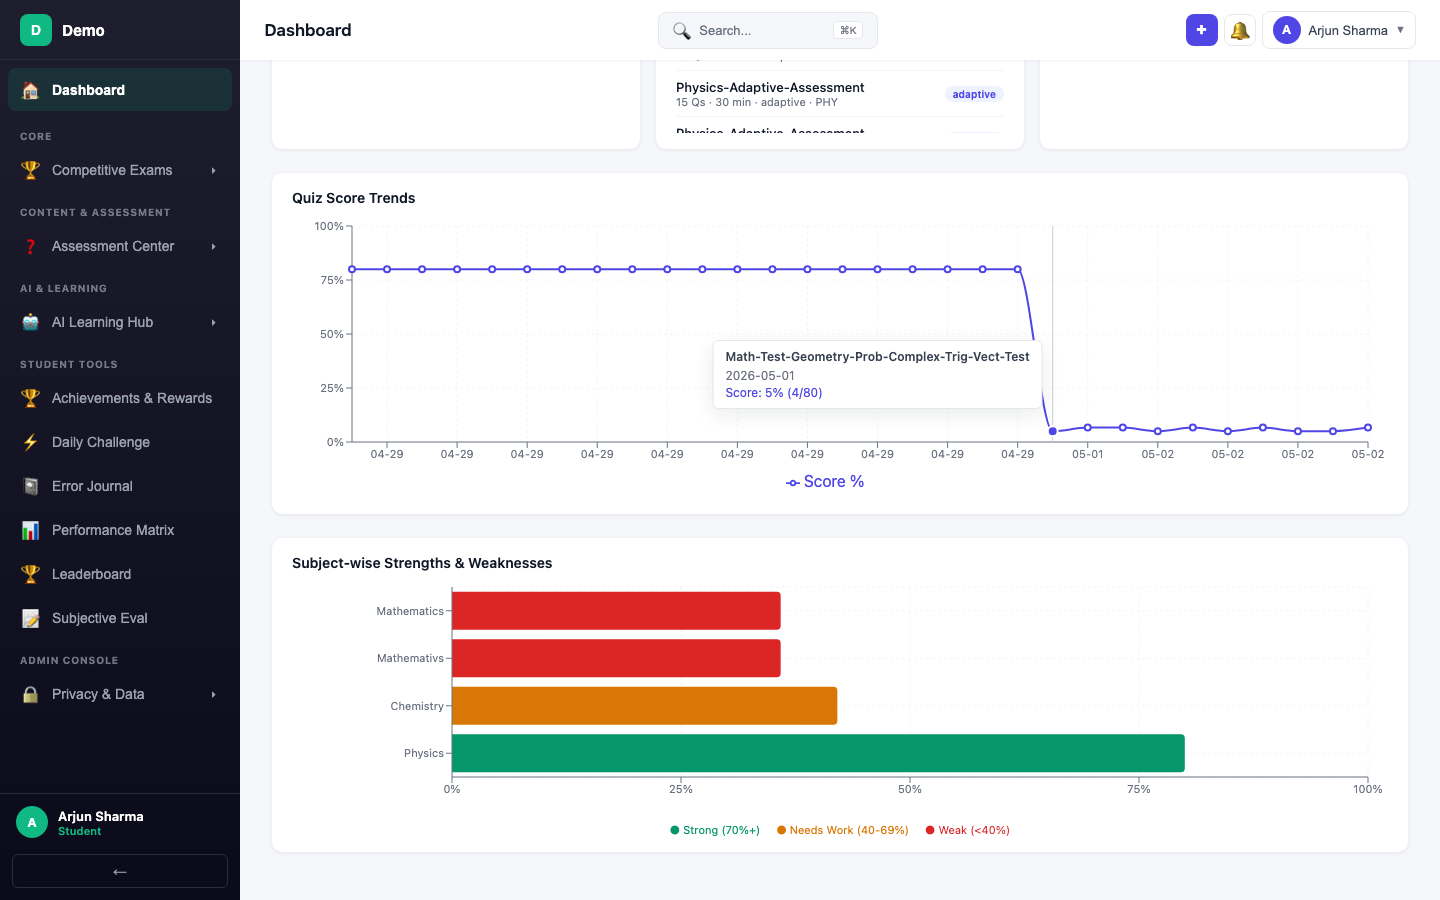
Quiz Score Trends
A line chart showing your score progression over time. Hover over any data point to see the quiz title, date, and score.
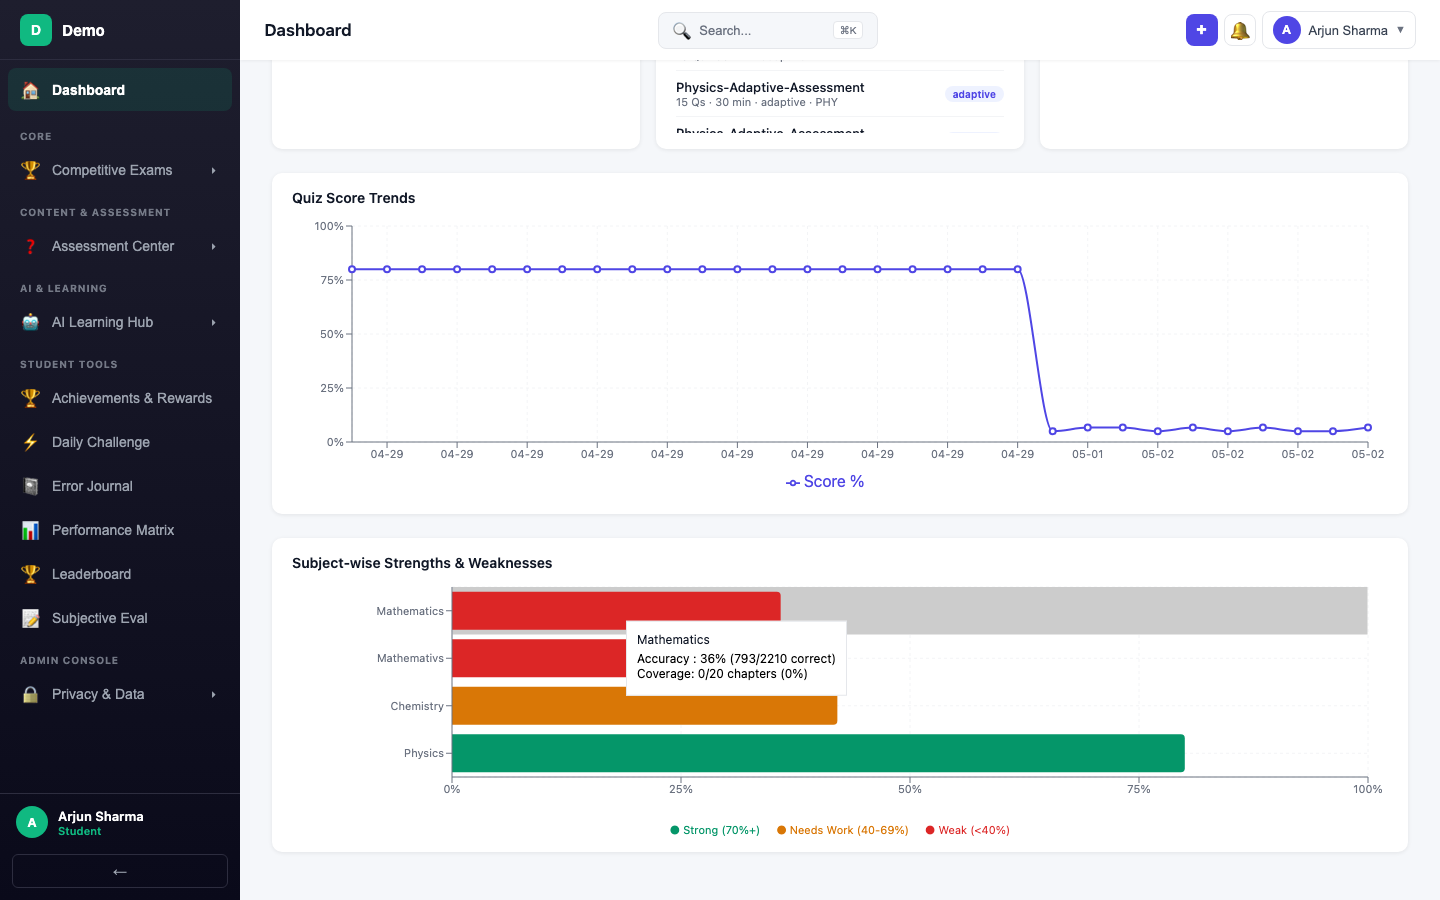
Subject-wise Strengths & Weaknesses
A horizontal bar chart showing your accuracy per subject, color-coded by performance level. Hover over any bar to see detailed stats.
B2B-Specific Differences
| Feature | B2C | B2B |
|---|---|---|
| Quizzes | Self-created only | Institute-assigned + self-created |
| Performance | Individual tracking | Tracked relative to batch averages |
| Content | Public content library | Batch content + program content from teachers |
| Study Plan | Based on personal performance | Also considers institute program schedule |
| Exam Countdown | Based on exam window | Aligned with institute's program end date |