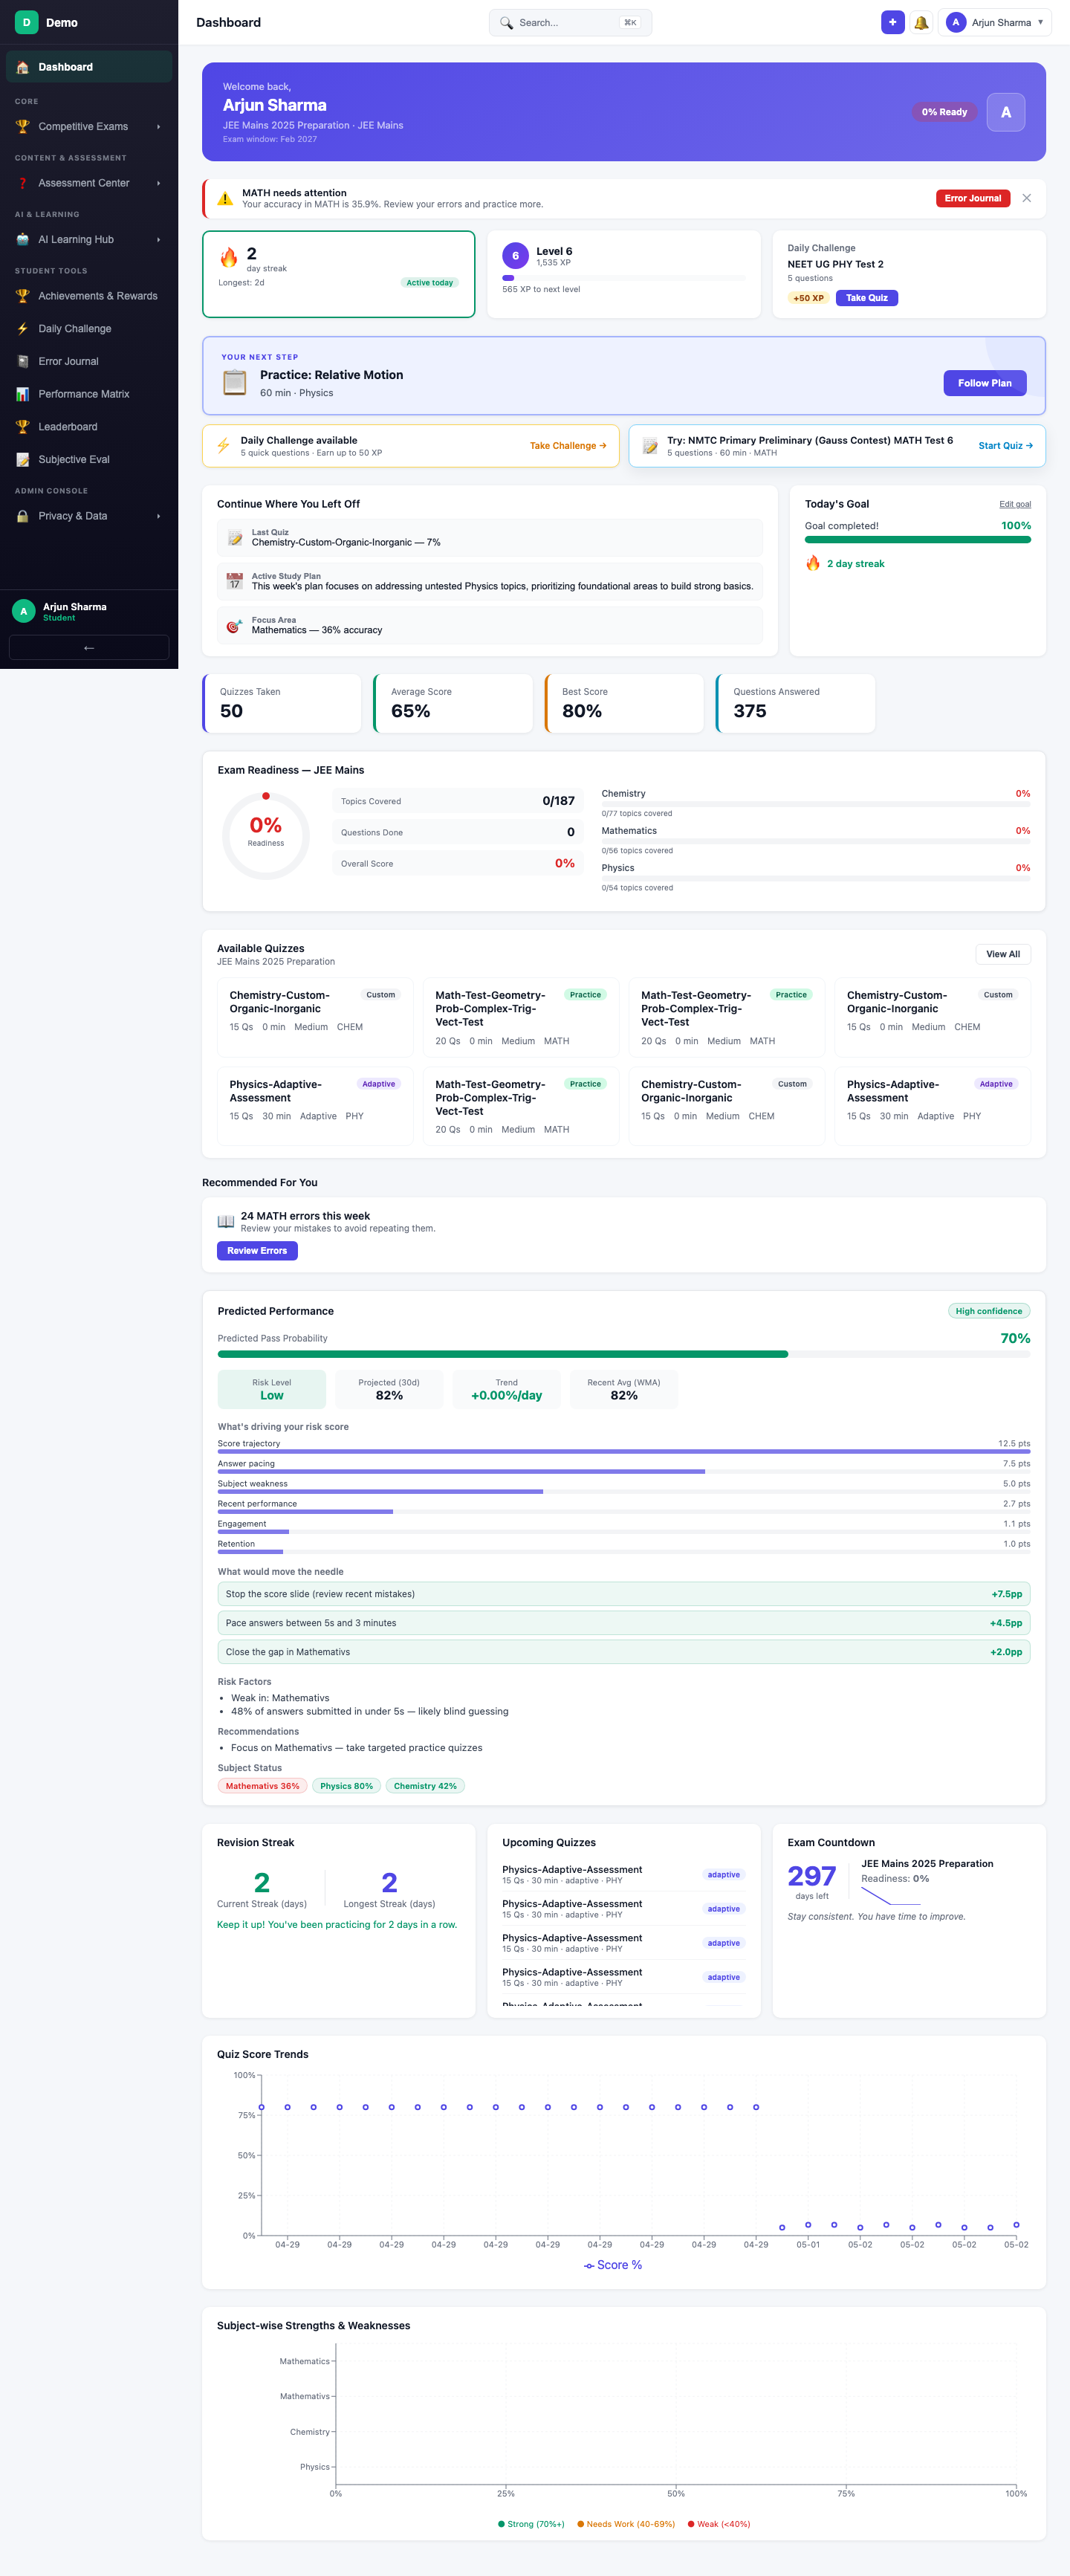
Student Dashboard
The student dashboard is your home base. It gives you a complete picture of your preparation progress, AI-powered recommendations, and quick access to every feature.
Video Walkthrough
Dashboard Overview
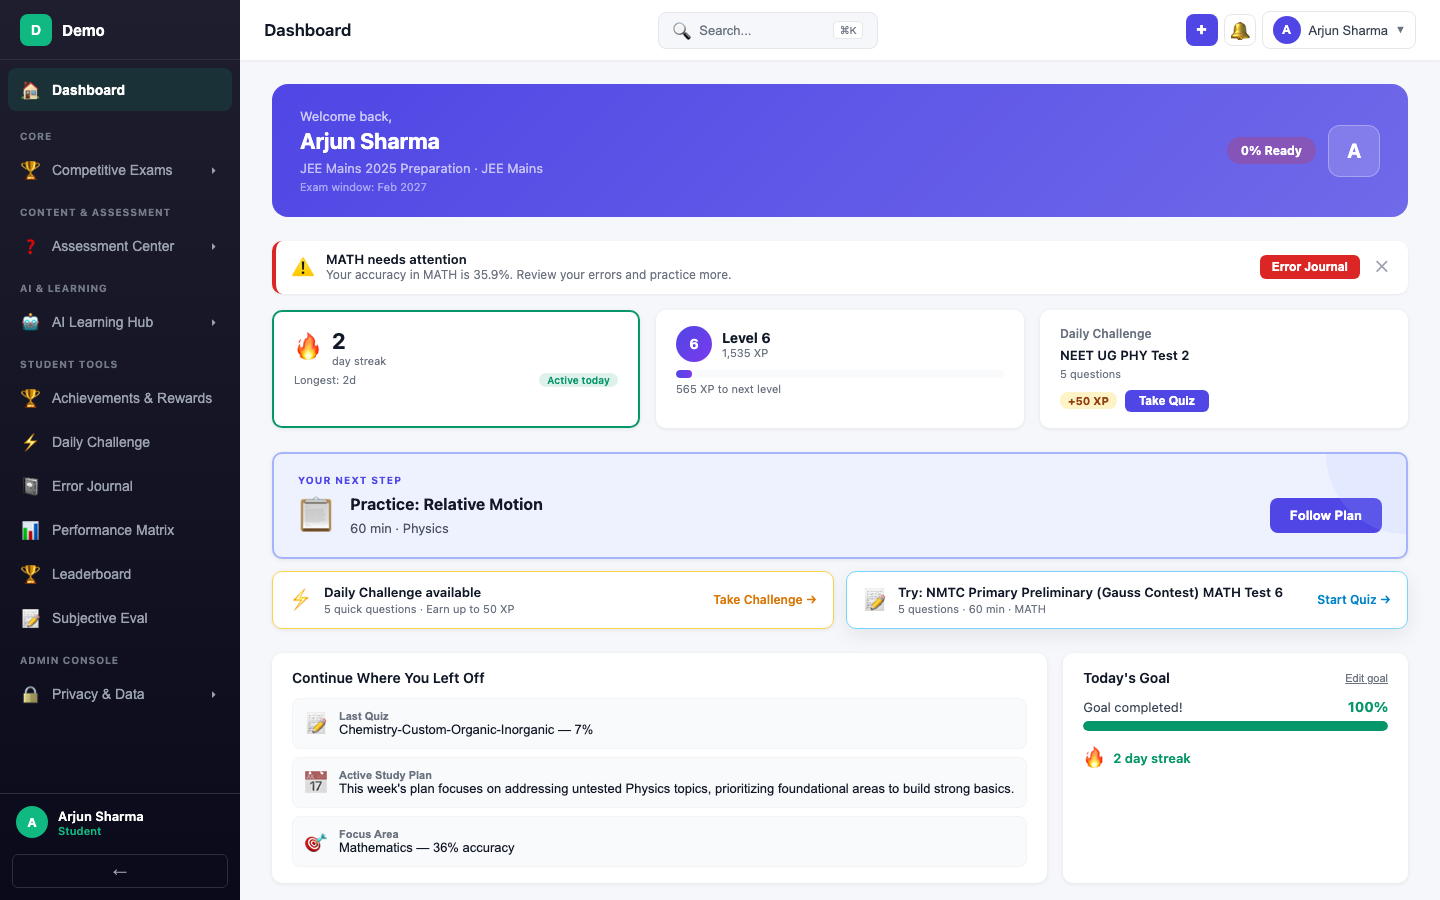
When you log in, the dashboard loads with all your key data in one place.
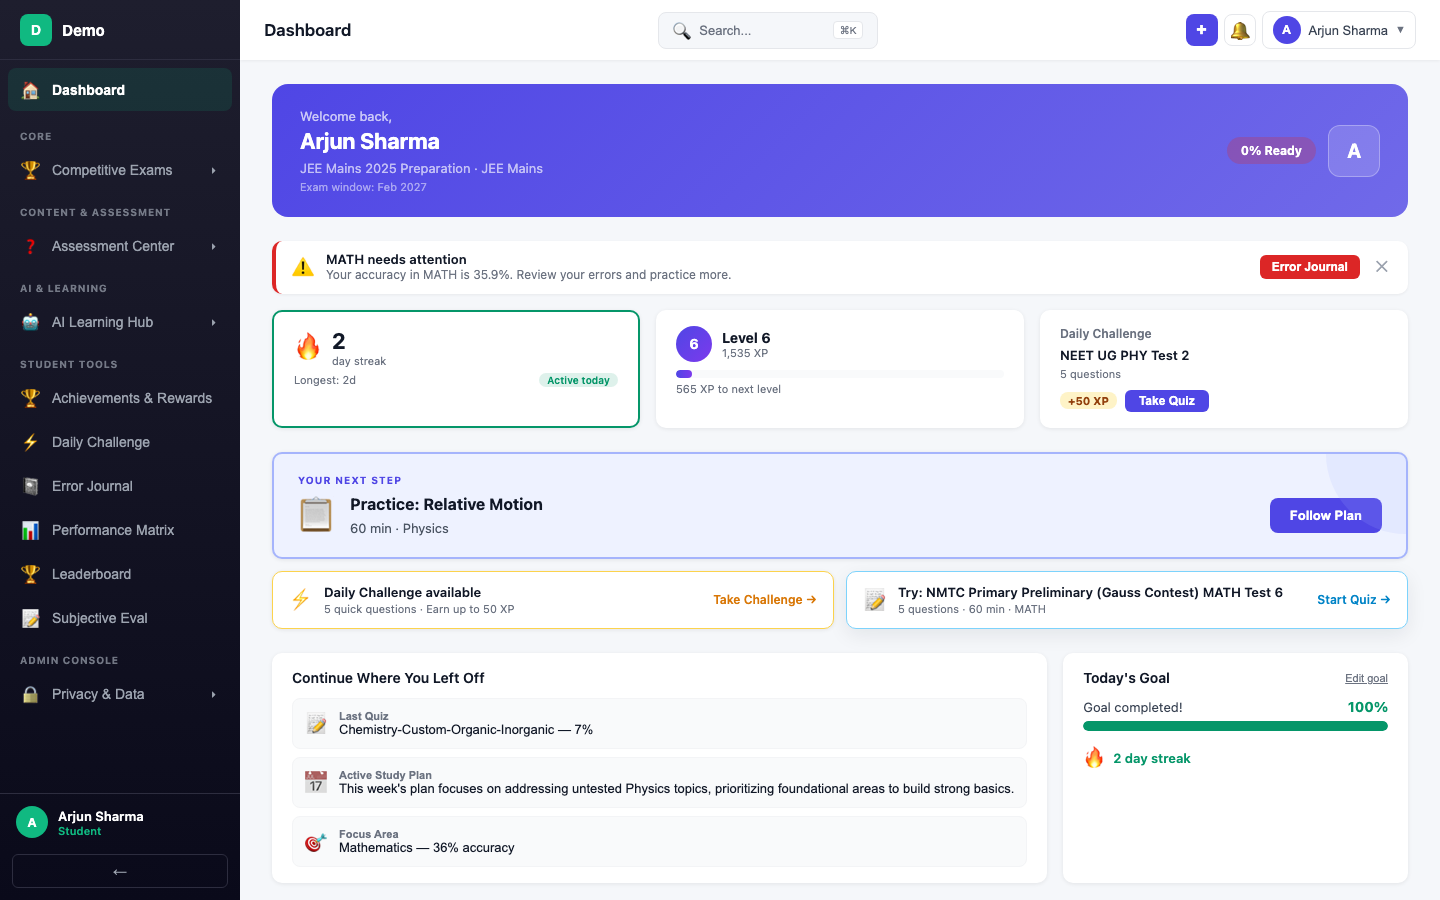
Welcome Banner & Readiness
The top banner greets you by name and shows your program. The Exam Readiness pill (e.g., 0% Ready) gives you an instant snapshot of how prepared you are.
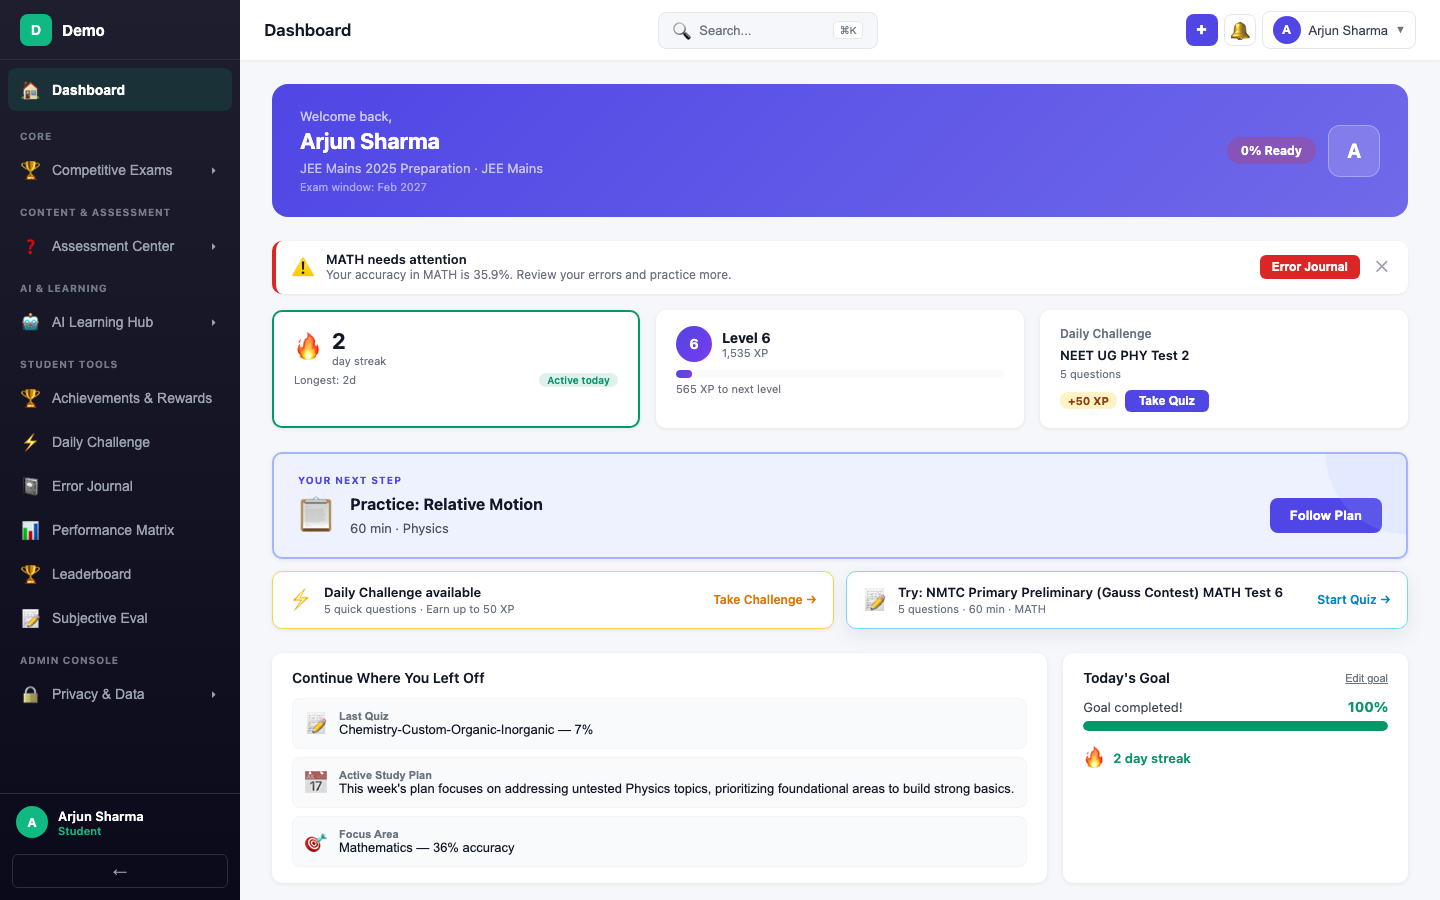
Streaks & Level
Below the banner, gamification widgets track your consistency:
- Streak — Current and longest consecutive practice days
- Level & XP — Your current level and progress to the next one
- Daily Challenge — A quick quiz for bonus XP
Your Next Step
The Your Next Step card highlights the single most impactful action you should take right now — whether that's following your study plan, taking a quiz, or reviewing errors.
Follow Plan
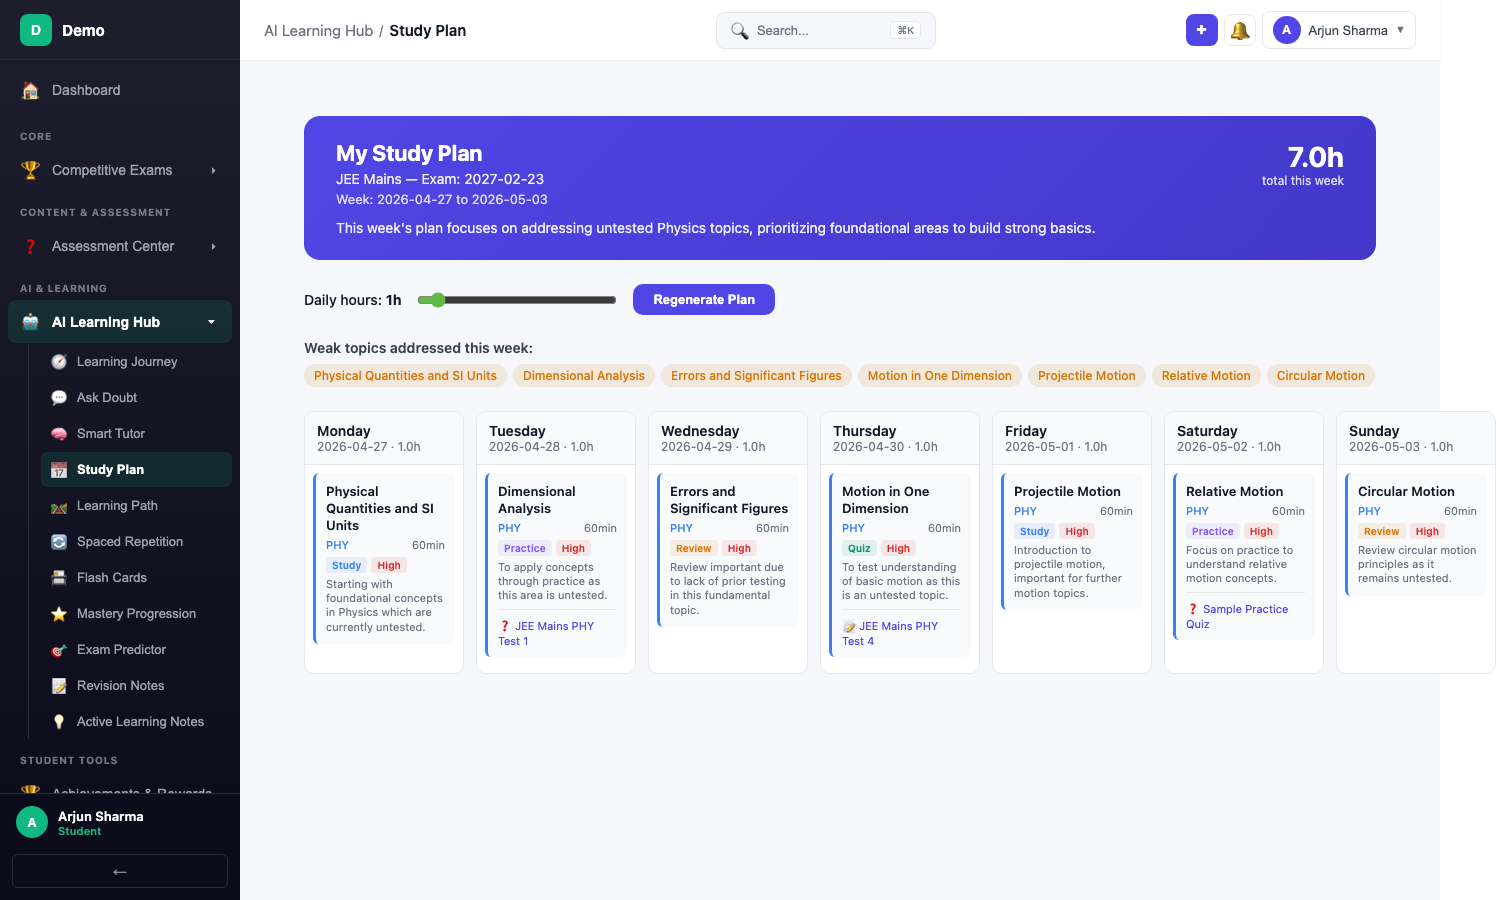
Click Follow Plan to jump directly to your AI-generated study plan.
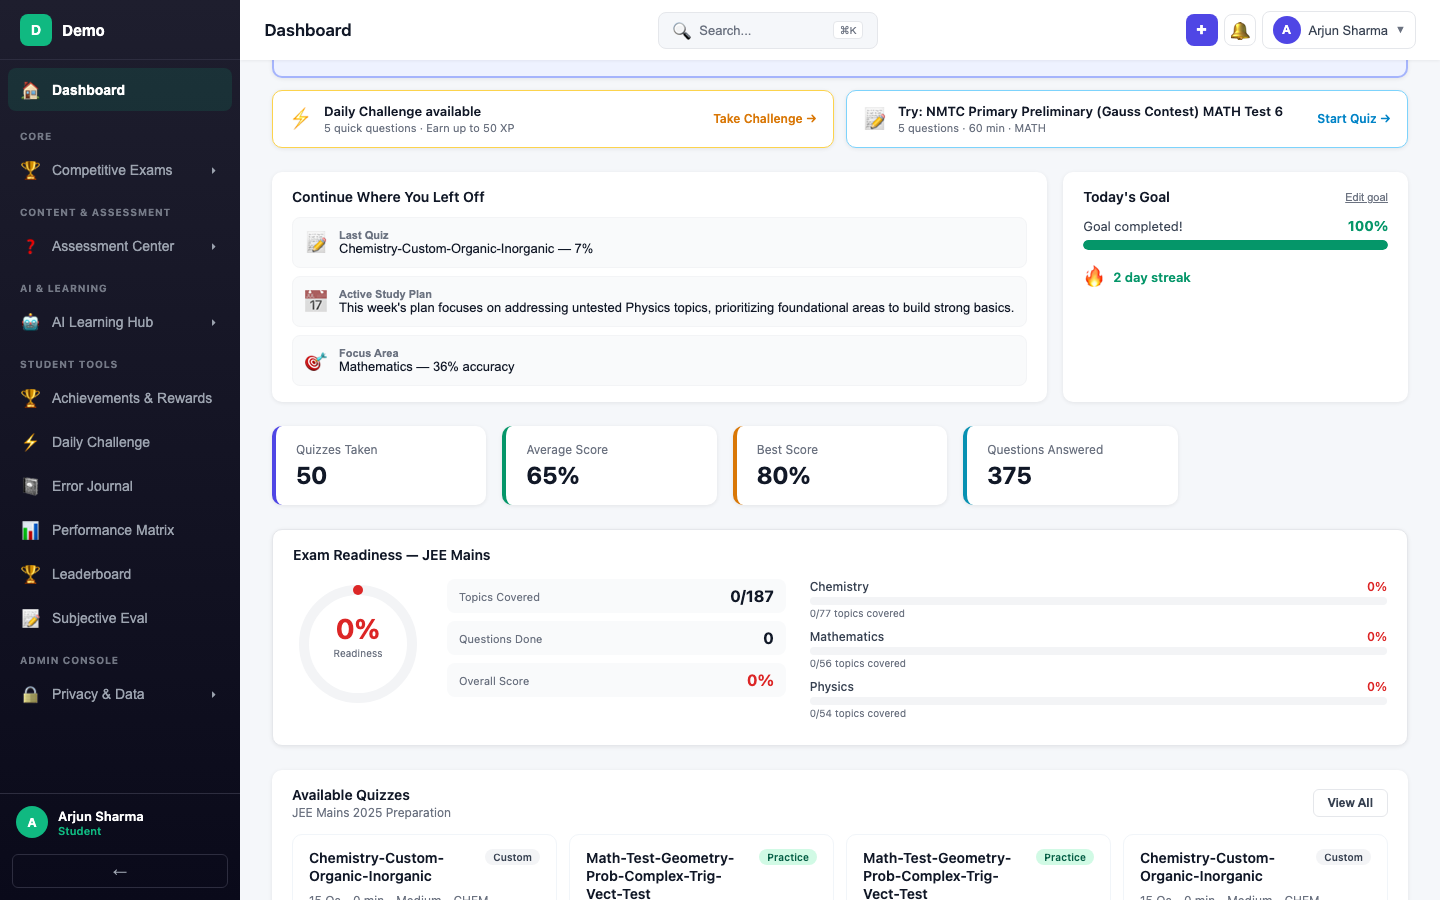
Continue Where You Left Off
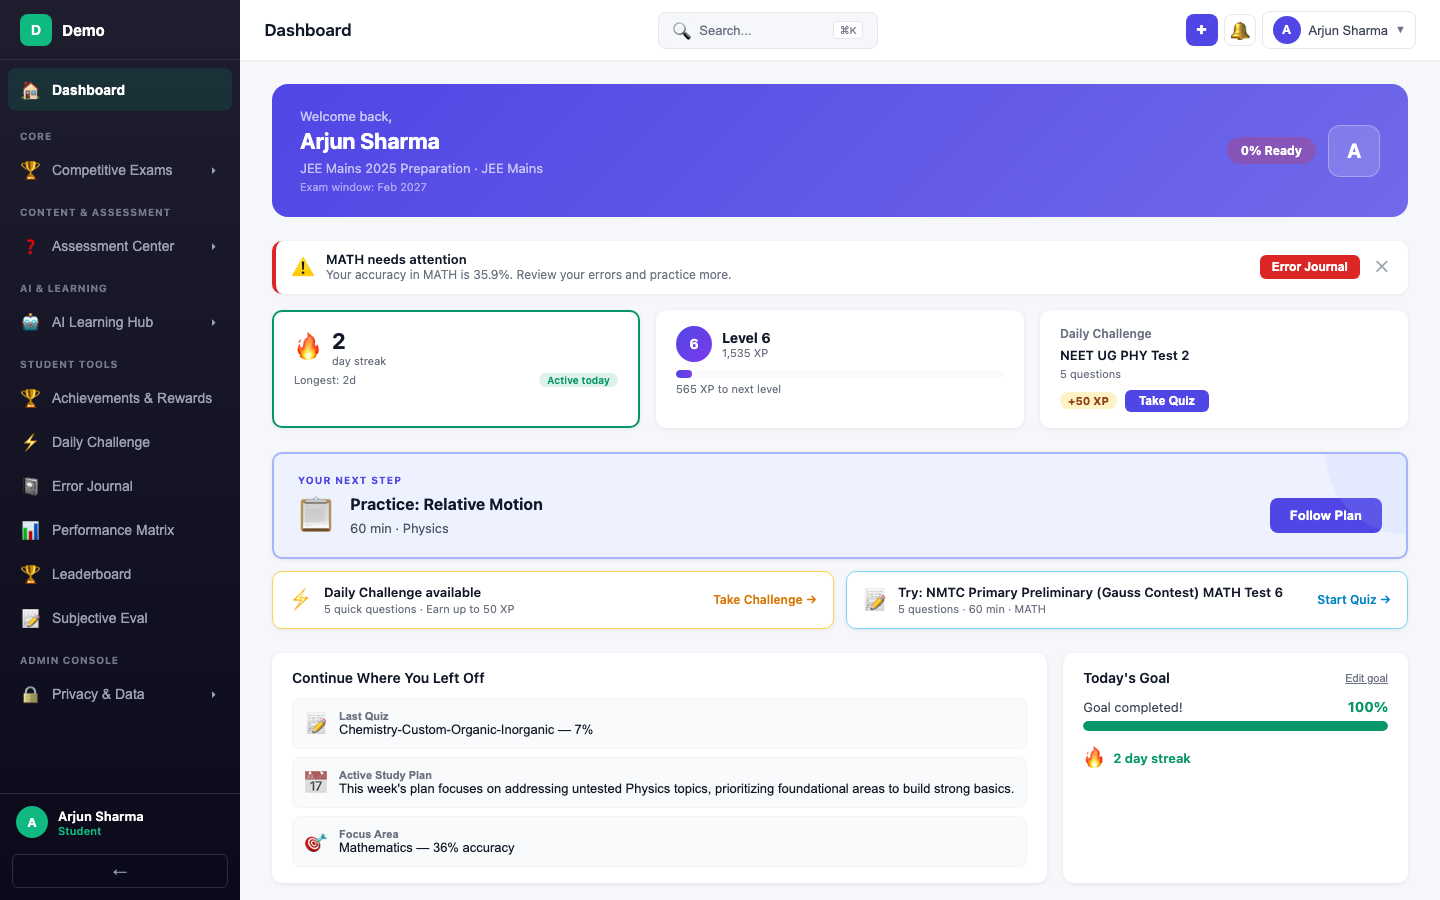
Back on the dashboard, this section shows your most recent activity for quick resumption:
- Last Quiz — Your most recent quiz with score
- Active Study Plan — Current week's plan summary
- Focus Area — The subject where you need the most improvement
Key Stats
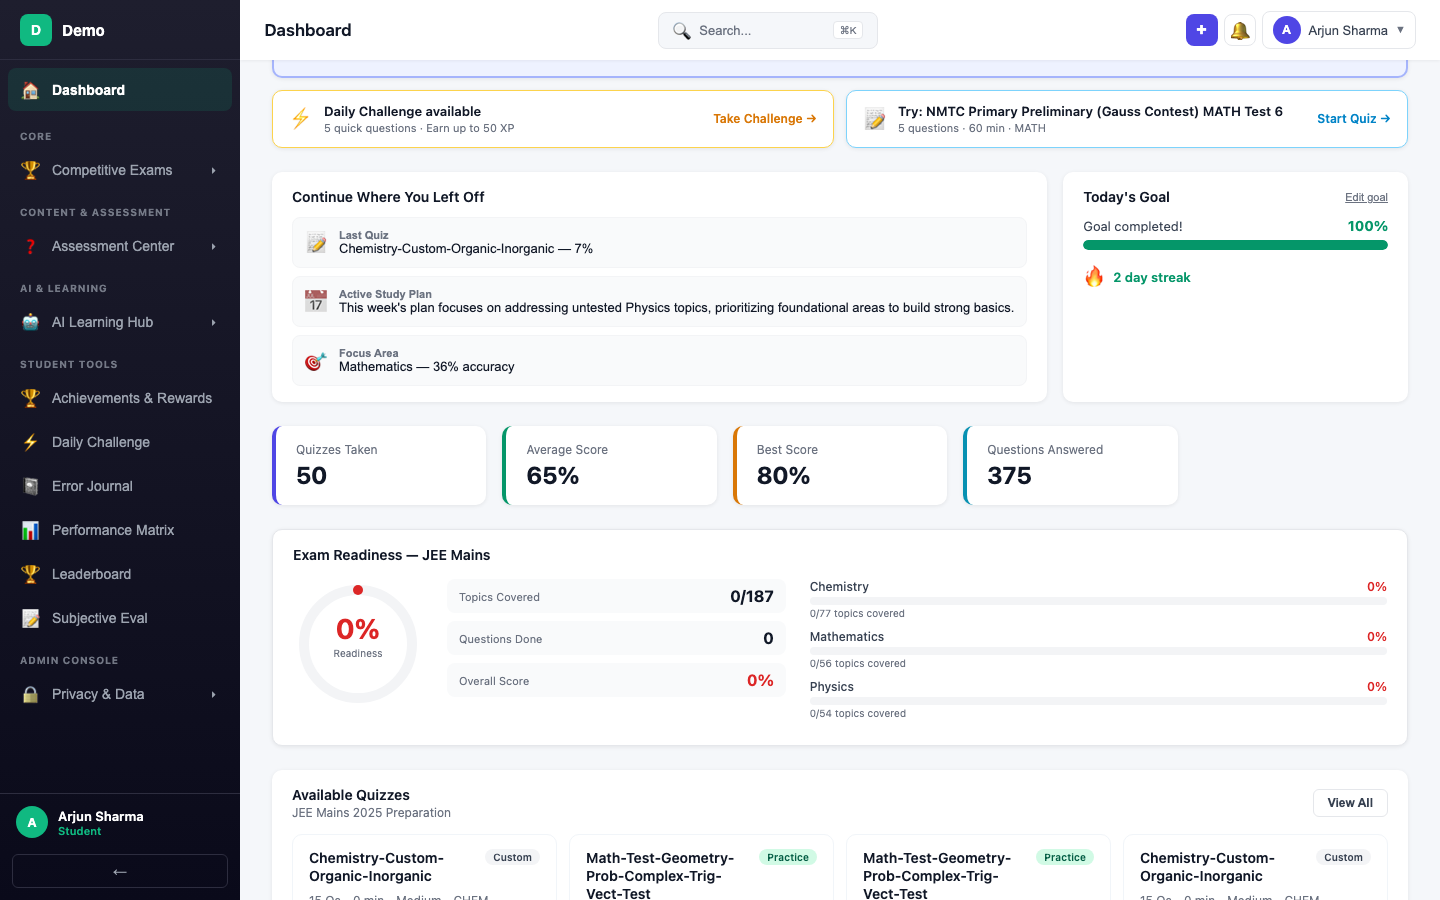
Four KPI cards give you the numbers at a glance:
| Metric | What It Means |
|---|---|
| Quizzes Taken | Total number of quizzes completed |
| Average Score | Your mean score across all quizzes |
| Best Score | Your highest quiz score |
| Questions Answered | Total questions attempted across all quizzes |
Exam Readiness
The Exam Readiness section shows a gauge with your overall readiness percentage, plus:
- Topics Covered — How many syllabus topics you've attempted
- Questions Done — Total questions answered
- Overall Score — Your aggregate accuracy
- Per-subject bars — Breakdown by subject with topic coverage
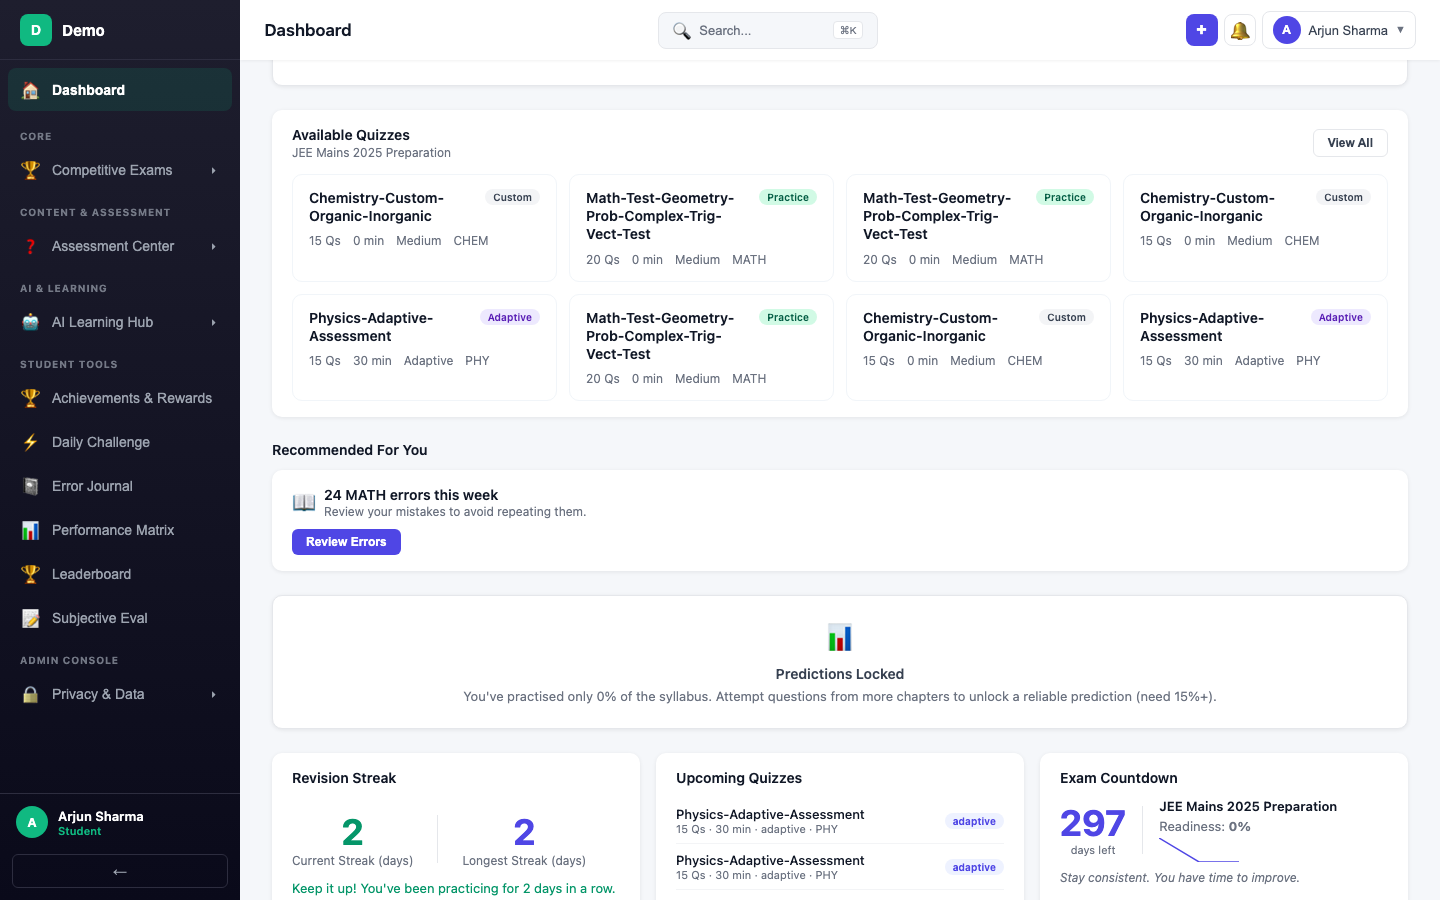
Recommended For You
AI-curated actions based on your performance — topics to revise, quizzes to attempt, and study suggestions tailored to your weak areas.
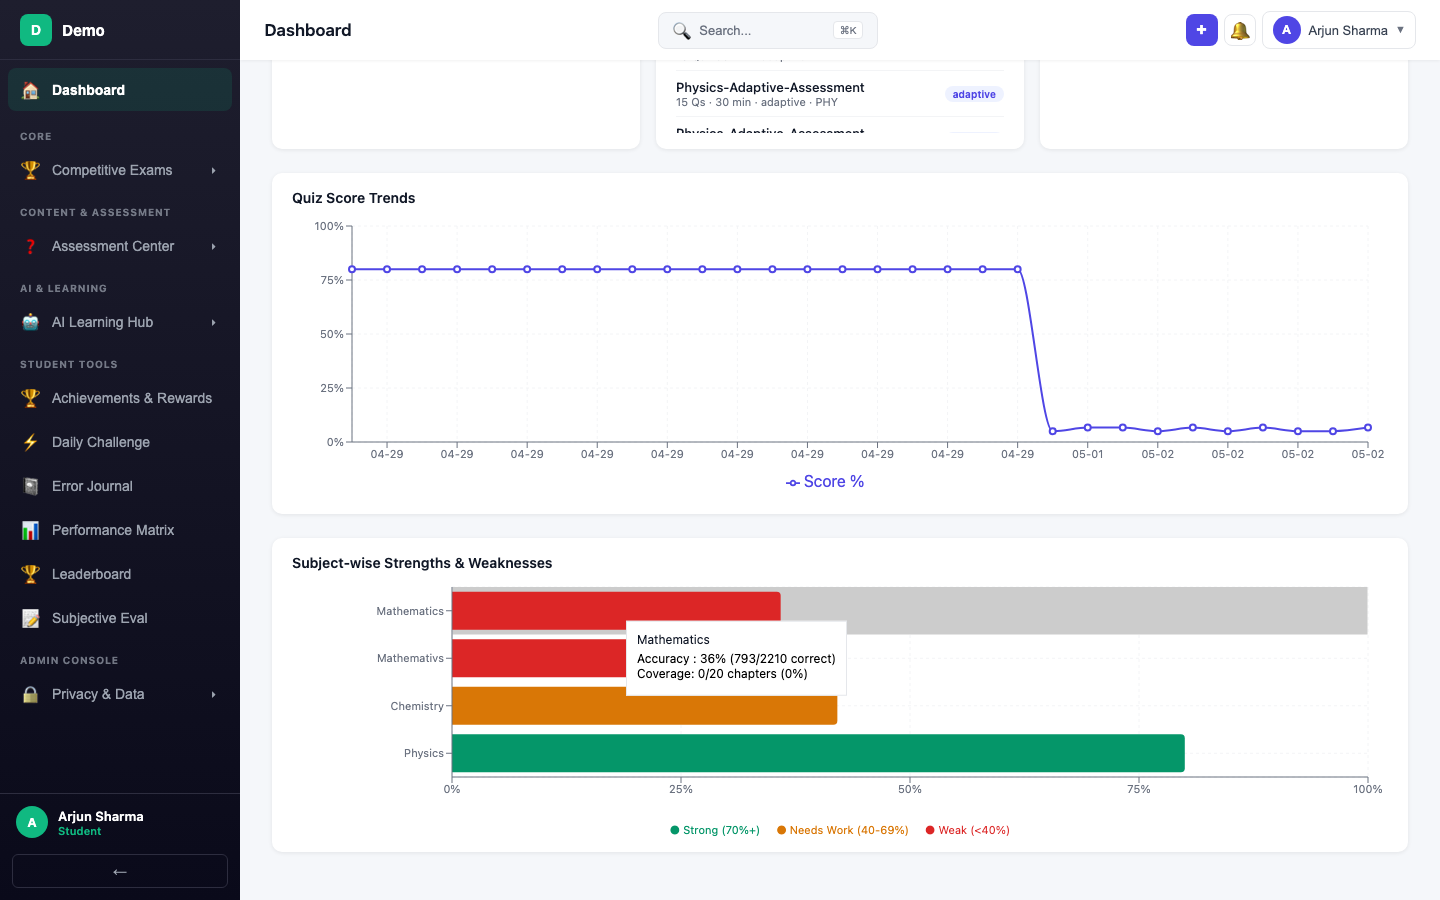
Quiz Score Trends
A line chart showing your score progression over time. Hover over any data point to see the quiz title, date, and score.
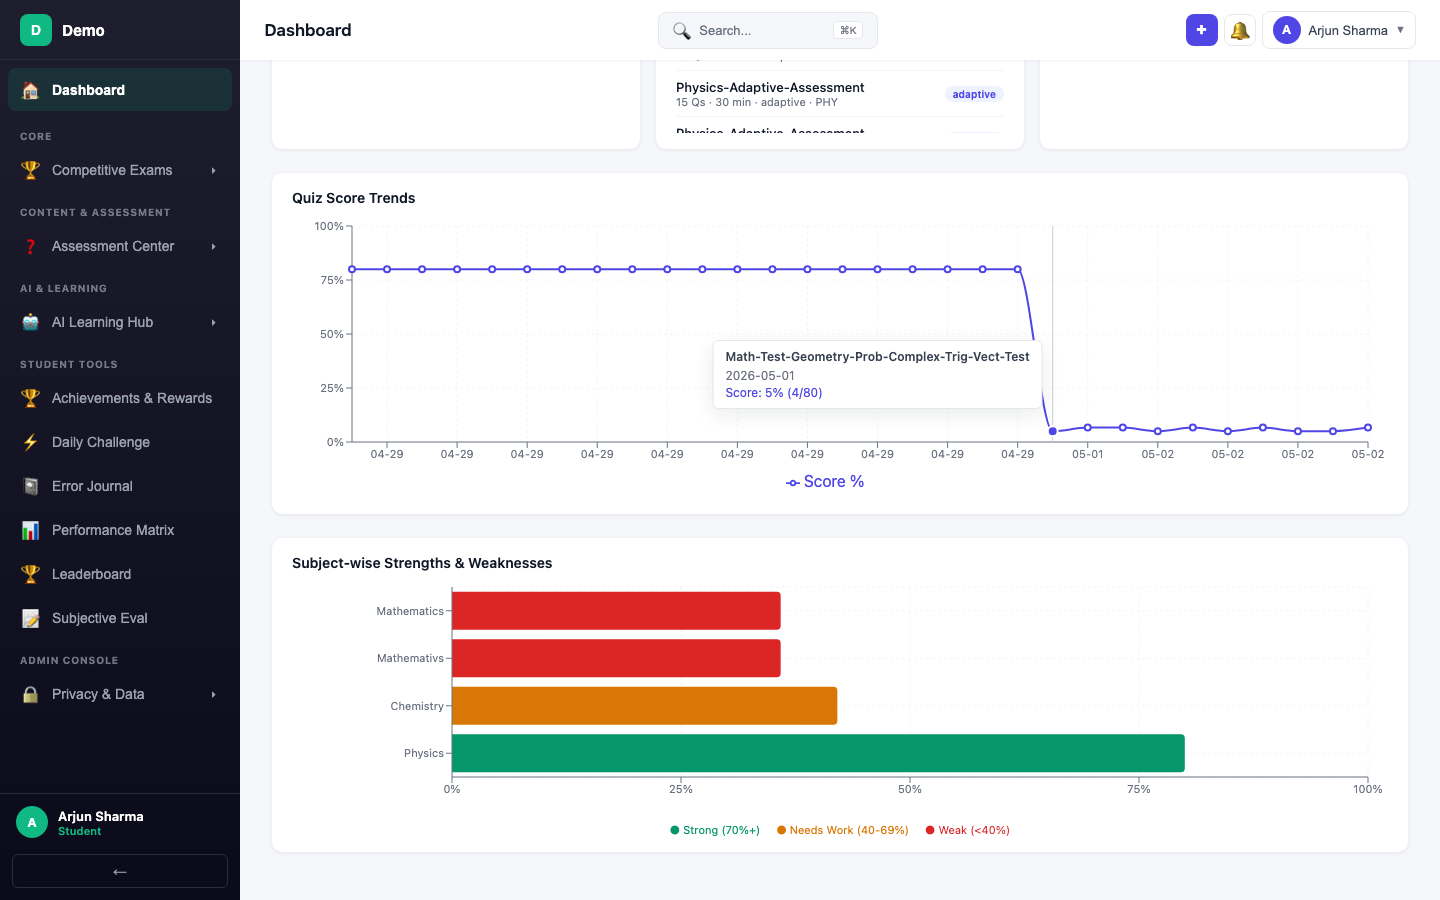
Subject-wise Strengths & Weaknesses
A horizontal bar chart showing your accuracy per subject, color-coded by performance level. Hover over any bar to see detailed stats.