Analytics & Reports
Monitor student performance, quiz activity, engagement trends, and AI usage across your organization.
Video Walkthrough
Analytics Dashboard
Navigate to Analytics → Dashboard for a comprehensive overview.
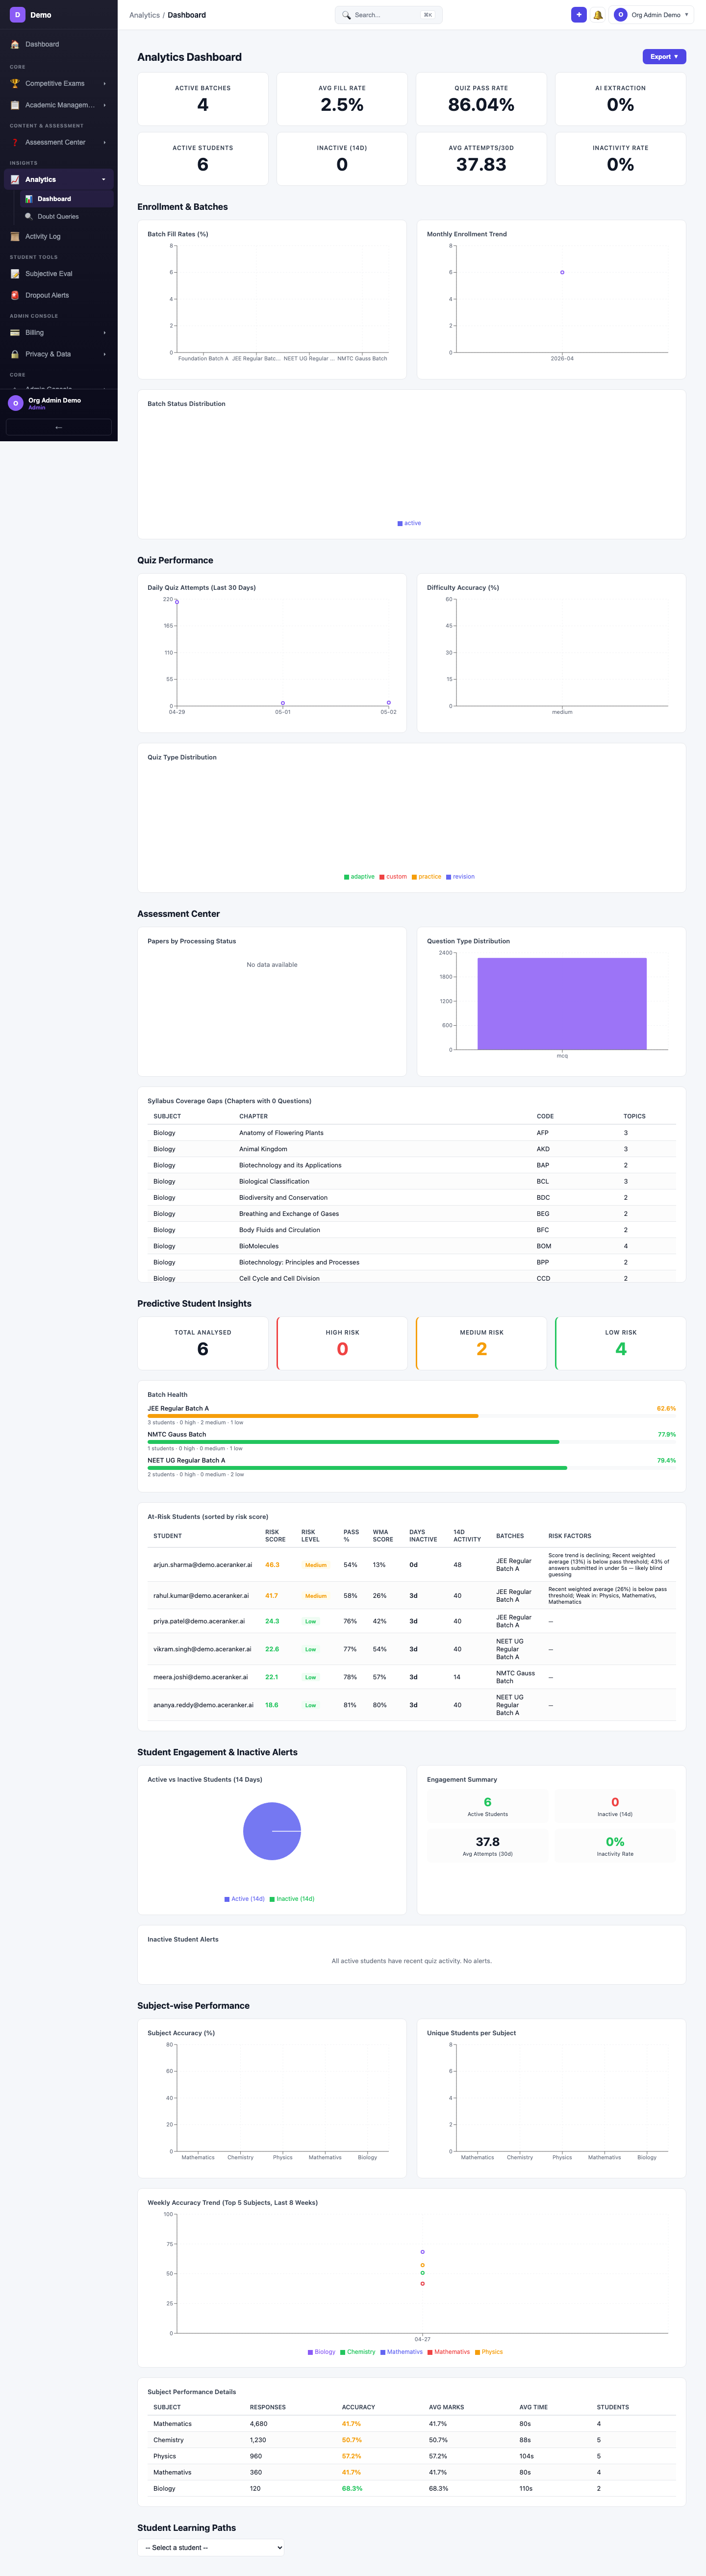
Dashboard Sections
| Section | What It Shows |
|---|---|
| Enrollment | Batch fill rates, enrollment trends, status distribution |
| Quiz Performance | Attempt trends, difficulty accuracy, type distribution |
| Assessment Center | Question bank stats, coverage by exam/subject |
| At-Risk Students | Predictive analytics for students needing attention |
| Engagement | Active vs. inactive students, login frequency |
| Subject Performance | Performance breakdown by subject |
Export
Click the Export button to download reports as PDF. You can export individual sections or all sections at once.
Doubt Analytics
Navigate to Analytics → Doubt Queries for AI usage insights.
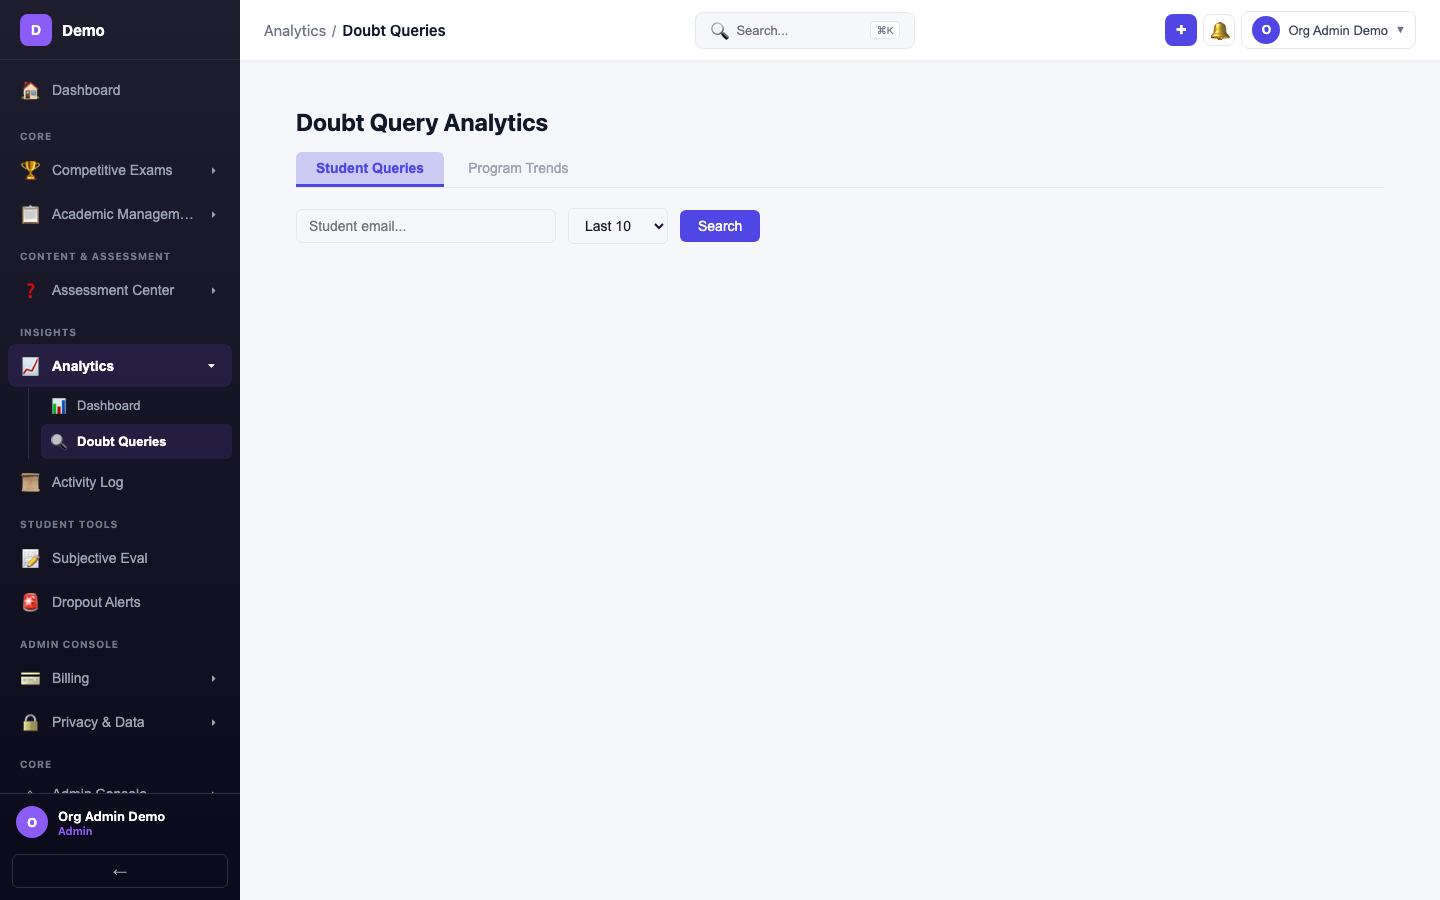
| Metric | Description |
|---|---|
| Total Queries | Number of doubt queries submitted |
| Popular Topics | Most-asked topics by students |
| AI Response Quality | Resolution rates and feedback scores |
| Cache Hit Rate | Percentage of queries served from cache |
Tips
- Review at-risk students weekly and assign targeted practice quizzes
- Track subject-wise performance to identify syllabus gaps
- Monitor doubt analytics to understand where students struggle most